
Home Blog

How to be charismatic: what research actually shows

0
Speaker seen from behind, hand raised mid-gesture, facing an attentive audience under a spotlight

To learn how to be charismatic, research points to observable, trainable behaviors: metaphors, stories, an animated voice, gestures, and facial expressions. Training improves charisma ratings, but the effect is moderate, takes practice, and can veer into self-parody. No method works miracles, and existing clinical trials rely on small sample sizes.

People often cite the 7%, 38%, and 55% ratio to claim that nonverbal cues dominate communication. Yet these figures stem from two 1967 studies by Mehrabian on narrow emotional cues, not an analysis of charisma. This guide separates observed research (speech tactics, voice, gestures, framing a vision) from common myths, detailing measured effects, modest outcomes, and real limits.

Key takeaways

  • Researchers define charisma as a leader’s symbolic influence grounded in emotional and ideological appeals, rather than an innate, mysterious trait.
  • Antonakis’s training program covers 12 charismatic leadership tactics: 9 verbal and 3 nonverbal (gestures, facial expressions, and an animated voice).
  • The 7-38-55 formula comes from two 1967 Mehrabian studies examining feelings and liking, not overall communication.
  • A charismatic speech boosted worker output by 17% in a field experiment, though impact varied by social context.
  • Trial sample sizes remain small, and awkward application by beginners risks turning into self-parody.

Charisma: definition and what research means by it

Researchers generally define charisma as symbolic influence exerted by a leader, built on emotional and ideological foundations. This definition remains debated, alongside a separate approach that examines everyday charisma.

The most widely cited framing comes from Antonakis, Fenley, and Liechti (2011), reported by People Matters. It states that the charismatic effect relies on signals interpreted by the audience—such as words, voice tone, and gestures—rather than formal authority.

In 2016, Antonakis, Bastardoz, Jacquart, and Shamir argued that charisma remains widely misunderstood. They pointed to vague definitions, conflation with transformational leadership (a style that rallies teams around a shared vision), unreliable questionnaires, and flawed causal models. These models are statistical analyses that jump to conclusions about one factor causing another. The authors proposed a definition rooted in signaling theory, which examines how a sender transmits information to a receiver.

Another line of research takes a different path. Tskhay, Zhu, Zou, and Rule (2017) describe an everyday charisma comprising two interpersonal dimensions: influence and affability (being warm and approachable). They validated a six-item tool, the General Charisma Inventory, presented as observable, measurable, and distinct from leadership constructs.

The word therefore carries two meanings. The first belongs to leadership: speeches, vision, and mobilizing groups. The second concerns everyday interpersonal presence. Most training trials outlined below focus on the first.

Is charisma innate or can it be learned?

Available data suggests charisma involves learned behaviors: structured training improved performance evaluations in 2011. Twin studies on leadership also show a heritable component, though without isolating charisma specifically.

Antonakis, Fenley, and Liechti (2011) directly tested whether individuals can be trained to act more charismatically. Their protocol used two experiments—one in the field and one in a laboratory. Training significantly improved charisma ratings, leader prototypicality, and leadership emergence.

On the genetic side, a 1998 twin study examined 247 adult twin pairs: 183 monozygotic (identical) pairs and 64 same-sex dizygotic (fraternal) pairs. It estimated that roughly 48% of the variance in transactional leadership stems from additive genetic heritability (the sum of individual gene effects). For transformational leadership, roughly 59% of the variance appeared linked to non-additive heritability (gene interactions).

That study does not resolve the charisma debate. Its measures relied on self-reports and evaluated general leadership rather than charisma alone.

The nature-versus-nurture dichotomy is therefore an oversimplification. Research points instead to trainable behaviors layered on top of baseline dispositions. Can charisma be learned? The most cautious answer is: partly, with moderate average effects and no guaranteed outcomes.

Some mainstream articles, such as coverage by WEKA, portray charisma alternately as an innate gift and a skill, citing Wiseman and Riggio without dates or formal citations.

How to be charismatic: tactics identified by research

The Antonakis program centers on 12 charismatic leadership tactics: 9 verbal and 3 nonverbal. Unlike vague advice about “presence,” these behaviors can be described, practiced, and evaluated.

The table below summarizes the tactics detailed by the British Psychological Society’s Research Digest. The right-hand column outlines observable examples in a speech.

Tactic Type What you observe
Metaphors Verbal An image linking the idea to a familiar situation
Stories and anecdotes Verbal A short narrative illustrating the message
Moral conviction Verbal Framing the issue around core values
Collective sentiments Verbal Expressing what the group feels
High expectations Verbal Setting an ambitious goal for the group
Confidence Verbal The speaker communicating confidence
Contrasts Verbal (rhetorical device) Pairing two opposite terms in one sentence
Lists Verbal (rhetorical device) A concise enumeration of points
Rhetorical questions Verbal (rhetorical device) Asking a question without expecting an answer
Gestures Nonverbal Hand and body movements that accompany the message
Facial expressions Nonverbal Expressions matching the content of the message
Animated voice Nonverbal A dynamic tone rather than a monotone delivery

Verbal tactics

Nine of the twelve tactics rely on language: metaphors, stories and anecdotes, moral conviction, collective sentiments, high expectations, confidence, and three rhetorical devices (contrasts, lists, and rhetorical questions).

These tactics map onto two broader concepts. Communicating a vision relies on setting high expectations, expressing confidence, and stating moral convictions. Emotional resonance relies on articulating collective feelings, supported by facial expressions and voice inflection. These links represent practical interpretations rather than formal categories in the original curriculum.

Voice and body language: the three nonverbal tactics

The three nonverbal tactics are body gestures, facial expressions, and an animated voice. According to People Matters, these are harder to master than verbal tactics and depend heavily on cultural context.

When it comes to vocal delivery, science offers no single recipe. A systematic review by Michalsky and Niebuhr (2019) tested ten common myths about charismatic speech, including the interaction between verbal and nonverbal cues, prosody (rhythm and intonation), breathing patterns, and fundamental frequency (average pitch). The findings were mixed: some claims held up, others were refuted, and several remained inconclusive. Rigid targets for pitch or breathing exercises lack empirical backing.

The 7-38-55 myth: do voice and gestures drive everything?

No. The 7%, 38%, and 55% rule does not prove that body language and tone override words in every situation. It comes from two 1967 Mehrabian studies conducted under highly specific laboratory conditions.

One of these papers, “Decoding of inconsistent communications,” was authored by Mehrabian and Wiener (Journal of Personality and Social Psychology, 6(1), 109–114). In Silent Messages (2nd edition, 1981), Mehrabian explicitly stated that his formulas apply only to communications about feelings and attitudes (liking versus disliking). He added that the exact numerical values in his equation are approximate, according to a blog article citing these excerpts.

The same source notes that the findings applied to conflicting messages where spoken words contradicted nonverbal signals. Listeners did not know the speaker, the setup was artificial, and the sample size was very small. These details come from a secondary source and are not verified in the original paper.

The rule has been broadly misapplied as a universal law. Charisma research demonstrates otherwise: 9 of the 12 core tactics are verbal, meaning content matters. Work on your delivery and body language, but prioritize crafting the message: an apt metaphor or a relevant story remains central to observed charisma.

How researchers measure leadership charisma

Charisma research relies on third-party assessments and behavioral metrics rather than self-evaluations alone. Even so, researchers acknowledge that survey questionnaires in the field have historically suffered from low reliability.
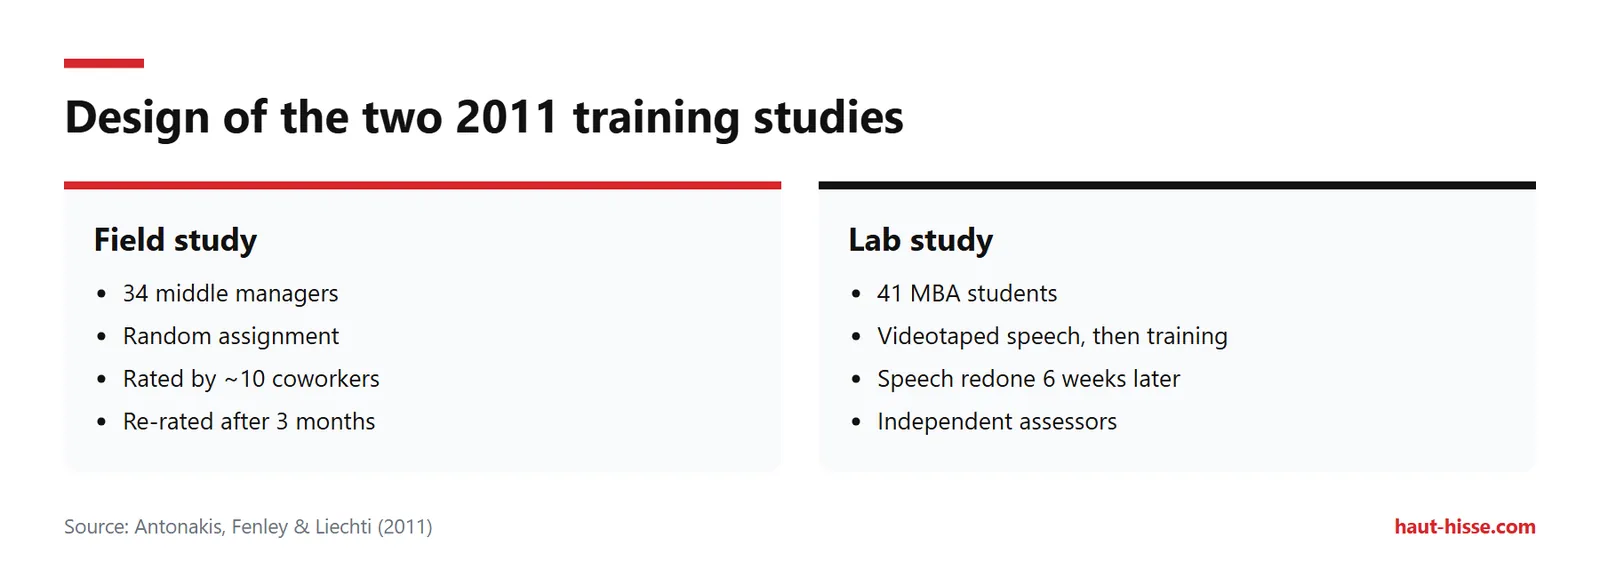
Two 2011 designs: field study with 34 managers at 3 months, lab study with 41 MBA students at 6 weeks.
Design of the two 2011 training studies — Source: Antonakis, Fenley & Liechti (2011)

In the 2011 field experiment, 34 middle managers were evaluated by themselves and by roughly ten coworkers each. Participants were randomly assigned to a training group or a control group. Training took place one month after the baseline measurement, and follow-up ratings were collected three months later.

The accompanying laboratory experiment involved 41 MBA students. Each student delivered a filmed speech, completed the training, and delivered the speech again six weeks later. Independent raters assessed the performances.

The 2016 review urges caution when reviewing older studies due to weak questionnaires and poorly specified causal models. For everyday presence, the General Charisma Inventory by Tskhay and colleagues uses six items to evaluate influence and affability.

Another approach measures hard behavioral outcomes. In a 2021 experiment detailed on John Antonakis’s University of Lausanne page, researchers evaluated charisma through the speed and quality of work completed. This eliminates reliance on subjective participant impressions.

Does charisma training produce measurable results?

Yes, but effects are moderate and limited to the observed timeframes. The 2011 training lifted charisma evaluations, while a charismatic speech led to a 17% increase in output in a 2021 field trial.
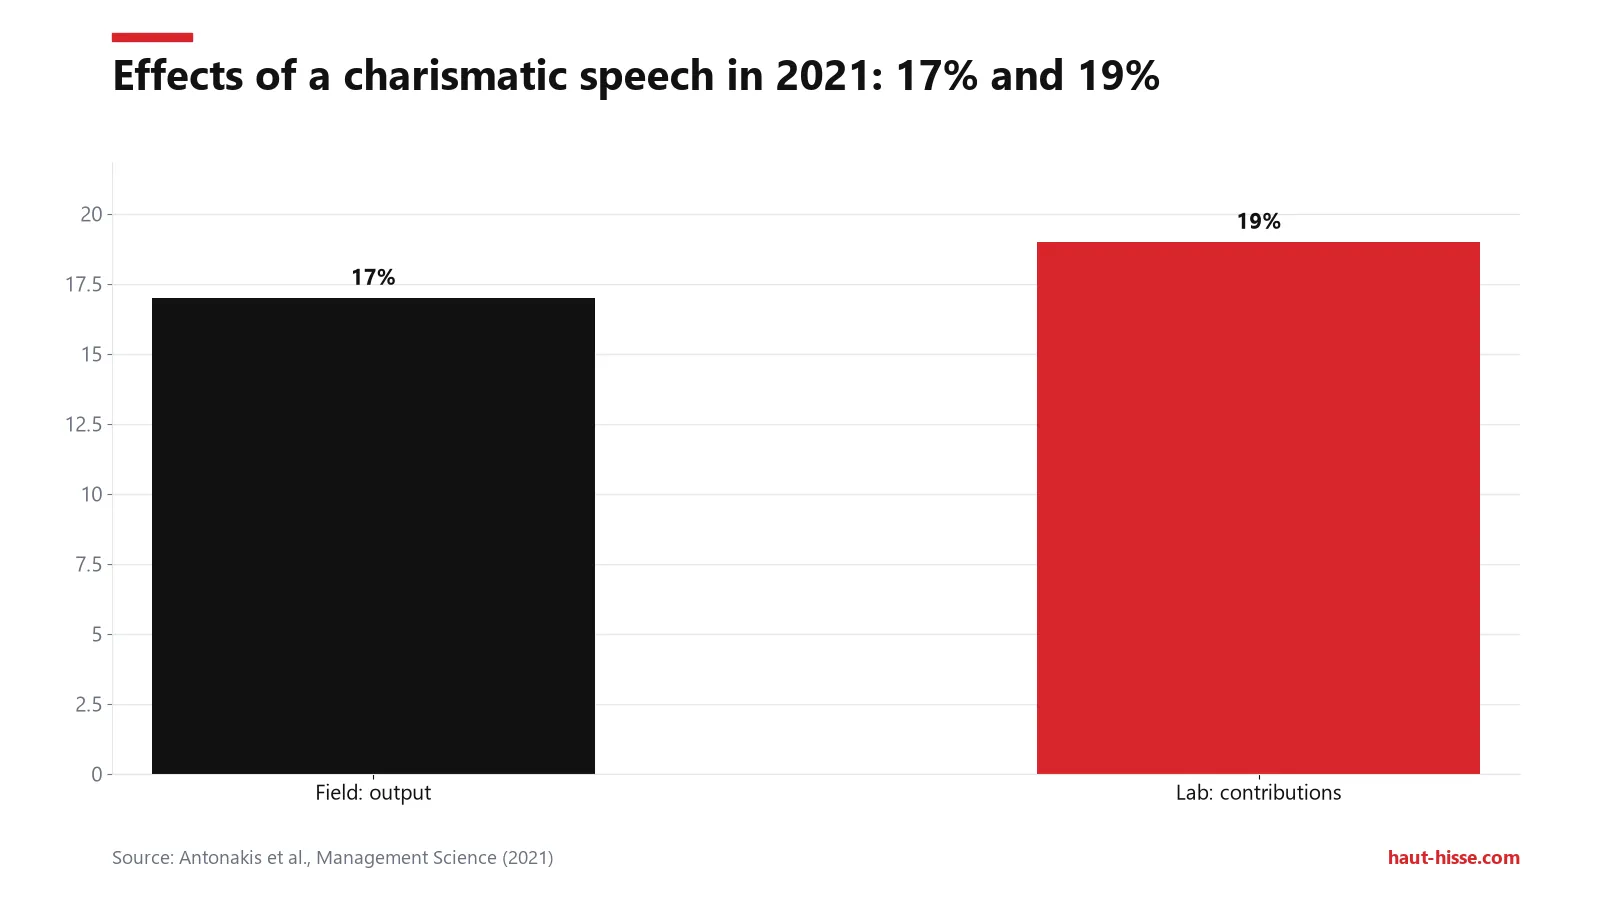
A charismatic speech raised output by about 17% (field) and contributions by up to 19% (lab).
Effects of a charismatic speech in 2021: 17% and 19% — Source: Antonakis et al., Management Science (2021)

The table below summarizes the four trials examined here. The 2021 figures come from the study published in Management Science.

Study Sample Follow-up period Result
2011, field 34 middle managers 3 months Gains in charisma ratings, leader prototypicality, and leadership emergence
2011, laboratory 41 MBA students 6 weeks Speeches incorporating more tactics received higher ratings (trust, competence, influence, affect, prototypicality)
2021, field Mail sorting workers Not specified Output roughly 17% higher following a charismatic speech compared to a standard speech
2021, laboratory Public goods game participants Not specified Contributions up to 19% higher, depending on the social context

The terms from the 2011 study have distinct meanings. Leader prototypicality reflects how closely a person fits the group’s mental image of an ideal leader. Leadership emergence describes the group’s tendency to recognize that person as their leader. Secondary reports describe the training effect as moderate, while the study’s abstract provides no exact numerical effect size.

The 2021 trial offers a practical example. According to John Antonakis’s profile, it compared three scenarios: fixed pay with a standard speech, fixed pay with a standard speech plus a piece-rate bonus above a production threshold, and fixed pay with a charismatic speech. The researchers tracked both output quality and quantity. According to the Management Science study, output rose by approximately 17% with the charismatic speech compared to the standard speech—an effect comparable to substantial financial bonuses.

In laboratory public goods games—where participants choose how much to contribute to a shared group pot—speeches with more charismatic markers increased contributions by up to 19%. However, speech effectiveness shifted depending on the broader social context.

Duration remains an open question. Tracking in these studies ended at six weeks and three months. No trials demonstrate longer-lasting effects.

Limitations, self-parody, and self-confidence

Charisma advice faces clear constraints: small trial samples, inconsistent outcomes across settings, and a genuine risk of self-parody. Self-confidence has not been proven as either a direct cause or a simple byproduct of charisma.

The authors of the 2011 research caution that mastering these tactics requires significant time; there are no shortcuts, and clumsy implementation by beginners can easily lead to self-parody. They characterized this pitfall as a “pantomime hand gesture and excruciating metaphor,” as reported by the BPS Research Digest. Both 2011 trials involved only a few dozen individuals, meaning results may not generalize across all professional settings.

Charisma does not guarantee broader effectiveness either. In two 2022 experiments, trained actors appeared in videos following a 2×2 design: charismatic versus neutral delivery, featuring female and male leaders. Charismatic delivery had no measurable effect on misinformation detection, persuasion, or prosocial behavior. In fact, participants recalled fewer messages from the charismatic leader than from the neutral leader. The 2021 findings in Management Science echo this conditional impact: the effectiveness of a speech depends heavily on the surrounding social context.

Self-confidence presents similar ambiguities. A career guide on Rekrute, based on a 2008 post, claims that “to win over others, you must first master yourself,” offering neither exercises nor evidence. The training trials reviewed here do not measure the impact of self-confidence on charisma ratings. Those interested in mindset can consult material on positive thinking by Napoleon Hill, though without expecting scientific validation.

Another popular concept is congruence. Discussed in La Libre (2017) based on a book by Catherine Berliet, congruence is presented as advice rather than a proven metric: aligning who you are, what you do, and what you say.

How to be charismatic in meetings and interviews

In meetings and interviews, focus on a few structured tactics at a time and practice them over several weeks. This protocol adapts the isolated tactics studied by researchers, though it has not been tested as a stand-alone interview method.

  1. Pick one core message and illustrate it with an image (a metaphor) or a short anecdote.
  2. State the shared goal alongside an ambitious yet achievable expectation. This combines collective sentiments, high expectations, and confidence.
  3. Use a contrast, a three-part list, or a rhetorical question to emphasize important points.
  4. For nonverbal delivery, focus on practicing just one behavior at a time (gestures, expressions, or vocal variety). These are harder to internalize and sensitive to context.
  5. Film your delivery or gather candid feedback, then redeliver the remarks several weeks later, mirroring the 2011 experimental setup.

In job interviews, stick to the verbal tactics and keep physical gestures subtle to prevent overacting. None of the studies cited show an impact on hiring outcomes; this routine trains speaking habits without promising job offers.

In meetings, assess your social setting. The 2021 experiments demonstrate that speech reception varies by group dynamic. A personal story that resonates with long-time team members may fall flat in front of unfamiliar stakeholders.

Frequently asked questions

What traits make a person charismatic?

Research focuses on observable behaviors rather than fixed personality traits. Tskhay and colleagues identified two dimensions of everyday charisma: influence and affability. In spoken communication, proven tactics include moral conviction, high expectations, and expressions of confidence.

How can you improve your voice and body language to be more charismatic?

Focus on practicing a single nonverbal tactic at a time, record your delivery, and review your progress several weeks later. Gestures, facial expressions, and vocal variety are harder to learn than verbal tactics. A review by Michalsky and Niebuhr shows mixed evidence regarding common vocal training claims.

How can you be charismatic if you are shy?

The relationship between shyness and charisma is not documented in the training trials cited, so caution is warranted. Because charismatic tactics consist of specific, concrete behaviors, you can practice them one at a time—such as opening with a concise metaphor or brief anecdote—before worrying about gestures or vocal pitch.

Does charisma differ between men and women?

No definitive evidence shows that charisma functions differently across genders. In a 2022 experiment evaluating male and female leaders in charismatic and neutral conditions, charisma changed neither persuasion nor prosocial behavior for either group. The tactics documented in training trials apply identically across genders.

Sources

  1. Antonakis, Fenley, and Liechti, charisma training experiments — Academy of Management Learning & Education (2011)
  2. Charisma involves teachable behaviours — British Psychological Society, Research Digest (2011)
  3. Can charisma be taught to leaders — People Matters
  4. Antonakis, Bastardoz, Jacquart, and Shamir, charisma literature review — Annual Review of Organizational Psychology and Organizational Behavior (2016)
  5. Tskhay, Zhu, Zou, and Rule, everyday charisma — Journal of Personality and Social Psychology (2017)
  6. Antonakis et al., charismatic speech and worker productivity — Management Science (2021)
  7. John Antonakis’s research profile on charisma — University of Lausanne
  8. Mehrabian and Wiener, Decoding of inconsistent communications — Journal of Personality and Social Psychology (1967)
  9. Ignore the big 55-38-7 myth of nonverbal communication — Cutting Edge PR
  10. Michalsky and Niebuhr, ten myths about charismatic speech — AUC Philologica (2019)
  11. Experiments on leader charisma and its effects — The Leadership Quarterly (2022)
  12. Nature vs nurture: are leaders born or made? — Twin Research and Human Genetics (1998)
  13. Charismatic people: how to persuade as a manager — WEKA
  14. How to develop charisma — Rekrute (2008)
  15. How do you develop charisma? — La Libre (2017)

Prepared with the help of AI tools, then fact-checked and edited by the Haut-Hisse editorial team.
How Liquid Death sells water in a can: the breakdown

0
Une canette noire mate posée sur un établi en bois, incarnant le marketing subversif de Liquid Death

This breakdown shows how Liquid Death sells water in a can. The answer is in the packaging and the story: a beer-style can, punk humor and live festivals turn ordinary water into a social object. The product itself isn’t new. The marketing built into the can is what creates the value.

Key takeaways

  • The can borrows the look and ritual of beer, giving a non-alcoholic drink a social signal.
  • The humor reverses the usual pitch for bottled water, selling attitude instead of purity.
  • Live events and grocery retail came in stages, after the brand had built its story.
  • The premium price pays for the packaging more than the liquid, and profitability is not published.

Revenue rose from about $3 million at the 2019 launch to an estimated $130 million in 2022, according to Contagious. That curve is surprising, because the liquid is not rare. This breakdown follows four mechanisms: the can, the humor, live events and price. It relies only on documented indicators: scanned retail sales, social media followers and store counts. It also explains what those numbers cannot prove.

How Liquid Death sells water: the product and the Warped Tour idea

Liquid Death is a canned water brand founded in 2018 by Mike Cessario, a former advertising creative, and the idea came from an observation made on tour. FoodNavigator reports that Cessario spent ten years in advertising and that the company is headquartered in Santa Monica, California. Wikipedia records that he filed the trademark on July 6, 2017, and that direct-to-consumer sales began in January 2019 on the brand’s official website.

The observation dates back to the Warped Tour. NoGood reports that Cessario saw performers filling Monster Energy cans with water. The starting point was a gesture, not a liquid. People were pouring water into a container that said something other than “water.” This reading is my interpretation.

The launch was prepared through content. Before the product went on sale, a teaser video had already passed 3 million views, according to Fortune. Contagious puts it bluntly: “there is no pretense of product innovation here.” The success comes from marketing, not from anything new in the bottle or the water source.

This logic connects to how price is perceived. A small presentation detail changes what the buyer believes they are paying, as our article on prices ending in 99 shows. At Liquid Death, that detail is the entire packaging.

Mechanism 1: the can that copies beer

The aluminum can gives a non-alcoholic drink the look and the gesture of beer, which answers a social need: having something to hold at the bar.

  • What you see: an aluminum can with a beer look and a metal aesthetic, where water is usually sold in plastic bottles.
  • The lever: borrowing the codes of another category, which makes the packaging a status signal.
  • The evidence: Cessario puts it this way in Fortune: “There’s no reason that only beer can have that kind of cool look and feel.” A Material survey, cited by Fortune, finds that 59% of Americans surveyed say they need a non-alcoholic drink to socialize.

The same interview gives the design principle. Cessario says he wanted to build marketing and shareability into the product itself, so that customers would promote it for free. The customer doesn’t just buy water. They buy an object they can show off, photograph and put on a festival table.

Can or plastic bottle: a status choice

Here is my analysis, which remains an interpretation. A plastic bottle talks about hydration, purity and sport. An opaque can with a metal look talks about belonging. It signals a taste, a crowd, a night out. The customer weighs a function (drinking) against a signal (showing who they are). In my view, the price pays for that signal much more than for the contents.

Who buys: Gen Z and the alcohol alternative

The brand claims more than 70% of its customers are Gen Z or millennials. The figure comes from Fortune, which reported the company’s statement in October 2025. The same Material survey, conducted among 1,000 Americans aged 18 to 42, finds that three in four want drinks with health benefits.

NBC News describes the brand’s core market as live-event audiences, with Live Nation events as a key channel. The brand also targets “sober curious” consumers, meaning people who cut back on or question their drinking.

The need I read in this data is simple: take part in the social ritual without alcohol, without feeling left out. The beer-style can answers that, and Cessario was looking for exactly that kind of object to hold at the bar. This is an analysis based on these elements, not proof of motivation for every customer. The survey also covers Americans, so its results don’t transfer directly to French consumers.

The recycling counterpoint

Aluminum also offers an environmental argument. A study by Eunomia, an environmental consulting firm, prepared for the International Aluminium Institute, reported by Recycling Magazine in 2022, puts the share of recycled material in new aluminum can products at about 70%. The figure is 40% for plastic and 34% for glass.

Two caveats apply. The study was commissioned by the aluminum industry. It measures a material, not the total impact of a brand, which also depends on transport, production and volumes.

Mechanism 2: punk humor that flips the codes of water

Liquid Death’s humor turns the usual pitch for bottled water, which sells purity and health, on its head, and makes the can recognizable in a second.

  • What you see and hear: a name, a metal aesthetic and an ironic tone that says the opposite of an alpine spring. In February 2022, the first Super Bowl LVI spot used “Breaking the Law” by Judas Priest and ended with “Don’t be scared, it’s just water.”
  • The lever: parody. The brand borrows the codes of menace and heavy metal, then defuses them with a reassuring line.
  • The evidence: the pre-launch teaser passed 3 million views, and the brand claims 14.5 million followers on TikTok and Instagram, according to Fortune. Both figures measure attention, not purchases.

I don’t attribute any specific intent to the brand. I am simply noting the gap between its tone and the category’s usual pitch.

Choosing the media

Cessario calls boring advertising on traditional media his “biggest waste of money,” FoodNavigator reports. He was talking about dull marketing, not about traditional media in general. Content therefore has to be entertaining enough to share, which explains the idea of building marketing into the product: “We needed to bake all the marketing and shareability into the product itself,” he told Fortune.

The Super Bowl spot and social media

The Super Bowl LVI spot was the brand’s first, Wikipedia states. What I notice in its final line is that it reassures in a parodic tone, as if drinking water were a risky act. It makes fun of the code it borrows and makes it likeable. The irony works as a signature.

On social media, the 14.5 million followers are a claim the brand made in October 2025, as Fortune reported. The figure is the company’s own statement, not an independent measurement. It shows the size of the audience, not conversion into sales.

Mechanism 3: live events and grocery retail

Liquid Death combined a presence at live events with Live Nation and a gradual push into grocery retail. Festivals offer a non-alcoholic option among bars that mostly sell beer.

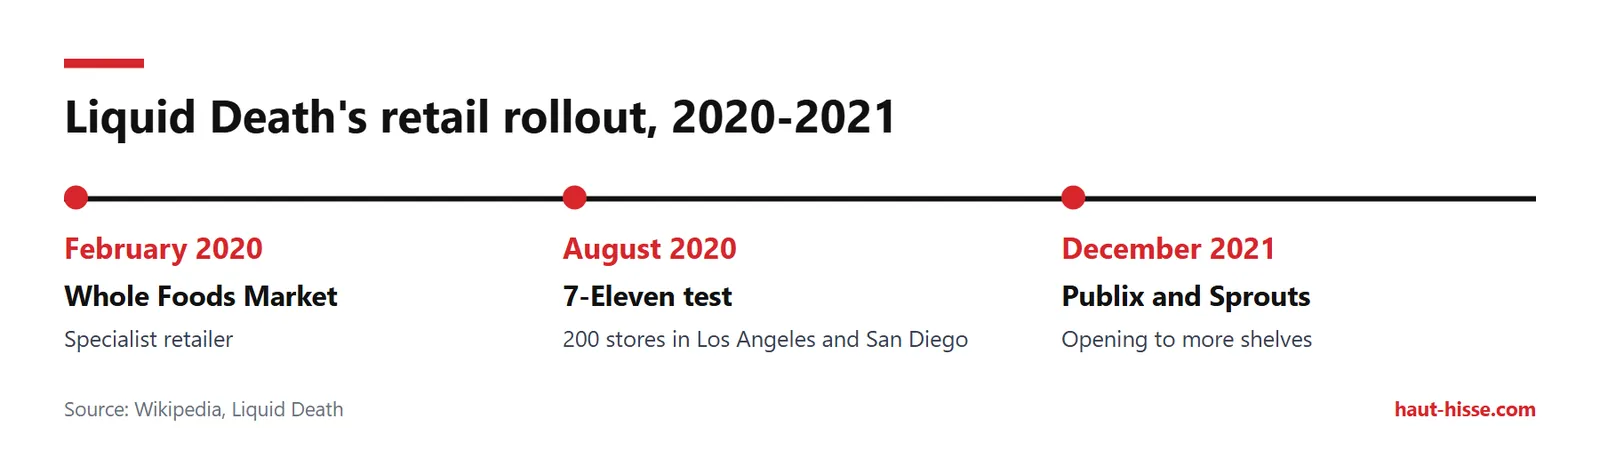
Timeline: Whole Foods in February 2020, 200 7-Eleven stores in August 2020, Publix and Sprouts in December 2021.
Liquid Death’s retail rollout, 2020-2021 — Source: Wikipedia, Liquid Death
  • What you see: the can in venues and at festivals, then on store shelves.
  • The lever: exclusivity on a channel where the brand’s story makes sense.
  • The evidence: in May 2021, Wikipedia reports, Live Nation took part in a Series C round (a funding round, detailed in the table below) and agreed to sell the drink exclusively at its events and venues for a period. NBC News describes Live Nation events as a key channel.

Grocery retail came later, in stages. Wikipedia’s timeline has three steps:

  1. February 2020: Whole Foods Market.
  2. August 2020: a test in 200 7-Eleven stores in Los Angeles and San Diego.
  3. December 2021: Publix and Sprouts.

This order suggests the brand first established itself where its story made sense (concerts, specialty retailers), then opened ordinary shelves. The question of distribution in France is covered in the FAQ below.

Mechanism 4: a premium price, about three times that of still water

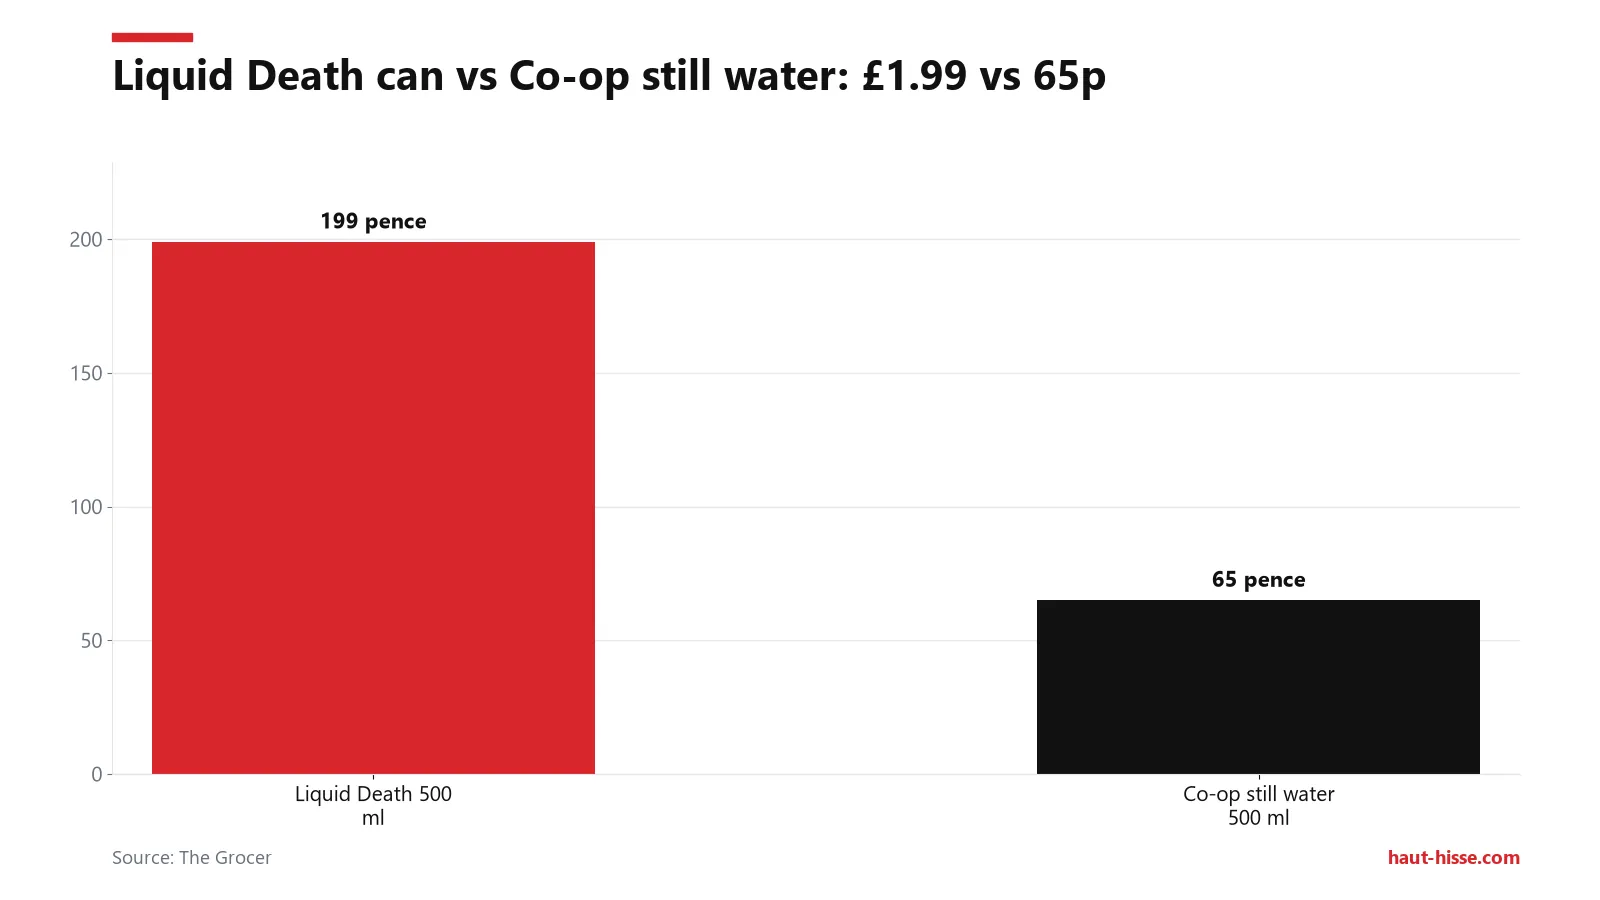
The premium price is the core of the model. In the UK, the can sold for about three times the price of still water in the same format.

Bars: 500 ml Liquid Death can at 199p vs 65p for Co-op still water, roughly three times the price.
Liquid Death can vs Co-op still water: £1.99 vs 65p — Source: The Grocer
  • What you see: a can of water priced like a status drink.
  • The lever: price as a signal of value, carried by the packaging more than by the contents.
  • The evidence: a 500 ml can of Liquid Death water cost £1.99 at Co-op, compared with 65p for Co-op’s own still mineral water in the same format, The Grocer reports. The math is simple: 1.99 ÷ 0.65 gives about 3.06.

This shelf price says nothing about Liquid Death’s margin. Between the store price and the brand’s bottom line sits the retailer, which keeps its share. To understand that layer, our article on how Costco makes money offers a comparison of grocery margin logic.

Revenue or scanned sales: don’t mix them up

The numbers circulate under different labels. “Scanned” sales are those recorded at store checkouts. They measure what customers pay, not what the company receives. Fortune notes that the sales cited are scanned retail sales, and the company’s revenue is not published. The table uses data from Fortune and FoodNavigator.

Indicator Value What the figure measures
Revenue at launch (2019) about $3 million Estimated revenue, cited by Contagious
Revenue 2022 about $130 million Estimate, not a figure published by the brand
Sales 2023 $263 million Scanned in-store sales
Points of sale 2023 113,000 United States and United Kingdom
Sales 2024 more than $300 million Scanned in-store sales
Growth since 2019 380% per year Compound annual growth rate (CAGR)
Share of flavored sparkling water and iced tea more than 60% Share of retail sales

The last figure complicates the image of a “water brand.” FoodNavigator reports that more than 60% of retail sales come from flavored sparkling water and iced tea, not still water. The brand is therefore mostly selling flavored drinks in the same can.

Profitability remains open. No data is published, and I draw no conclusion from it: strong sales growth proves neither a profit nor a loss.

What this case reveals: a mechanism to spot elsewhere

When the packaging does the messaging work, a traditional media budget becomes secondary. The table summarizes the four mechanisms. The “intended effect” column is my reading, not a goal the brand has declared.

Observed element Lever Intended effect
Aluminum can with a beer look Borrowing the codes of another category An object to hold at the bar, non-alcoholic, that people want to show off
Name, metal aesthetic, “Don’t be scared, it’s just water” spot Irony and reversal of water’s codes Instant recognition and content people want to share
Exclusivity with Live Nation at events and venues Presence on the channel where the story lives Reaching the core market of live-event audiences
Can at £1.99 vs 65p for Co-op still water Premium price as a value signal Charging for the social object rather than the liquid

To recognize this recipe in another brand, look for three signs: an ordinary product, packaging that borrows the codes of another category, and a message the customer wants to pass on.

Funding rounds: what the valuation proves and doesn’t prove

The successive rounds, from $9 million in 2020 to $67 million at a $1.4 billion valuation in March 2024, rest on sales growth and the strength of the brand. The table follows the timeline published on Wikipedia.

Date Round Amount Valuation
February 2020 Series A $9 million not specified
September 2020 Series B $23 million not specified
May 2021 Series C (with Live Nation) $15 million not specified
January 2022 Funding round $75 million $525 million
October 2022 Funding round $70 million $700 million
March 2024 Funding round $67 million $1.4 billion

The October 2022 round needs a caveat. It was led by an existing investor, Science. Dan Primack of Axios said, as Wikipedia reports, that it could be viewed with skepticism, because a round led by insiders sets a price without an outside test.

A further caution: the March 2024 valuation does not describe the brand’s current value, and it is neither revenue nor profit. When you read “a brand worth over a billion,” the date matters as much as the amount.

Ecological limits and criticism: what the analysis doesn’t prove

The aluminum environmental argument rests on an industry-funded study, and the brand has also faced criticism. It is important to separate what the figures prove from what the communication makes of them.

The Eunomia study for the International Aluminium Institute, reported by Recycling Magazine in 2022, gives about 70% recycled content for aluminum, 40% for plastic and 34% for glass. The study compares materials. It does not show that Liquid Death is more environmentally friendly than another brand on a full life-cycle basis.

In 2025, the brand ended its partnership with “The Deep,” a character from the series The Boys, and publicly apologized. NoGood links the break to a scene in which the character burned plastic waste near children. The same article reports that critics argue the beer-style can may normalize alcohol for children.

Finally, three things sit outside this analysis:

  • The causal link between a campaign and sales is not established. No one can prove which channel (the Super Bowl, videos, festivals) produced which sales.
  • Customer acquisition metrics are not published, including acquisition cost and retention.
  • Profitability is not known.

This breakdown explains why the can works as a social object. The analysis cannot quantify what each lever brings in.

Frequently asked questions

Who created Liquid Death?

Mike Cessario, a former advertising creative director, founded Liquid Death. The idea came to him at the Warped Tour, when he saw performers filling Monster Energy cans with water. The company is headquartered in Santa Monica, California.

How much is Liquid Death worth today?

The most recent published valuation dates from March 2024 (see the funding rounds table). No more recent value is documented. A valuation is neither revenue nor profit.

Where can I buy Liquid Death in France?

The documented points of sale are in the United States and the United Kingdom. Nothing confirms distribution in France. Check the brand’s website or ask your retailer before counting on finding it on a local shelf.

Is Liquid Death profitable?

Nobody knows. The brand does not publish its revenue or its profit. The known figures are scanned in-store sales, which measure what customers pay, not what the company keeps.

Sources

  1. Liquid Death, official website
  2. Liquid Death’s marketing and brand-building strategy, FoodNavigator (2024)
  3. Liquid Death marketing, NoGood (2026)
  4. Liquid Death, Wikipedia (2026)
  5. Liquid Death names new CFO as $1 billion brand gears up for expansion, Fortune (2025)
  6. Liquid Death CEO Mike Cessario, interview on water, beer and unicorn status, Fortune (2024)
  7. Liquid Death CEO Mike Cessario, Gen Z, beer and water, Fortune (2024)
  8. How Liquid Death became a billion-dollar beverage brand, NBC News (2024)
  9. Why Liquid Death is our brand of the year, Contagious (2022)
  10. What is Liquid Death and is it about to take the UK by storm?, The Grocer (2024)
  11. Study highlights vital role of aluminium cans in circular economy, Recycling Magazine (2022)

Prepared with the help of AI tools, then fact-checked and edited by the Haut-Hisse editorial team.
How much does Mr Bean earn? What we actually know

0
Une voiture verte classique garée sous la lumière londonienne avec une enveloppe rouge sur le pare-brise

On 29 October 2018, Mr Bean’s official YouTube channel reached 10 million subscribers, according to Chortle. Fewer than 100 channels worldwide had crossed that threshold at the time. It had started with clips from the 14 episodes broadcast on ITV, the British commercial broadcaster, between 1990 and 1995.

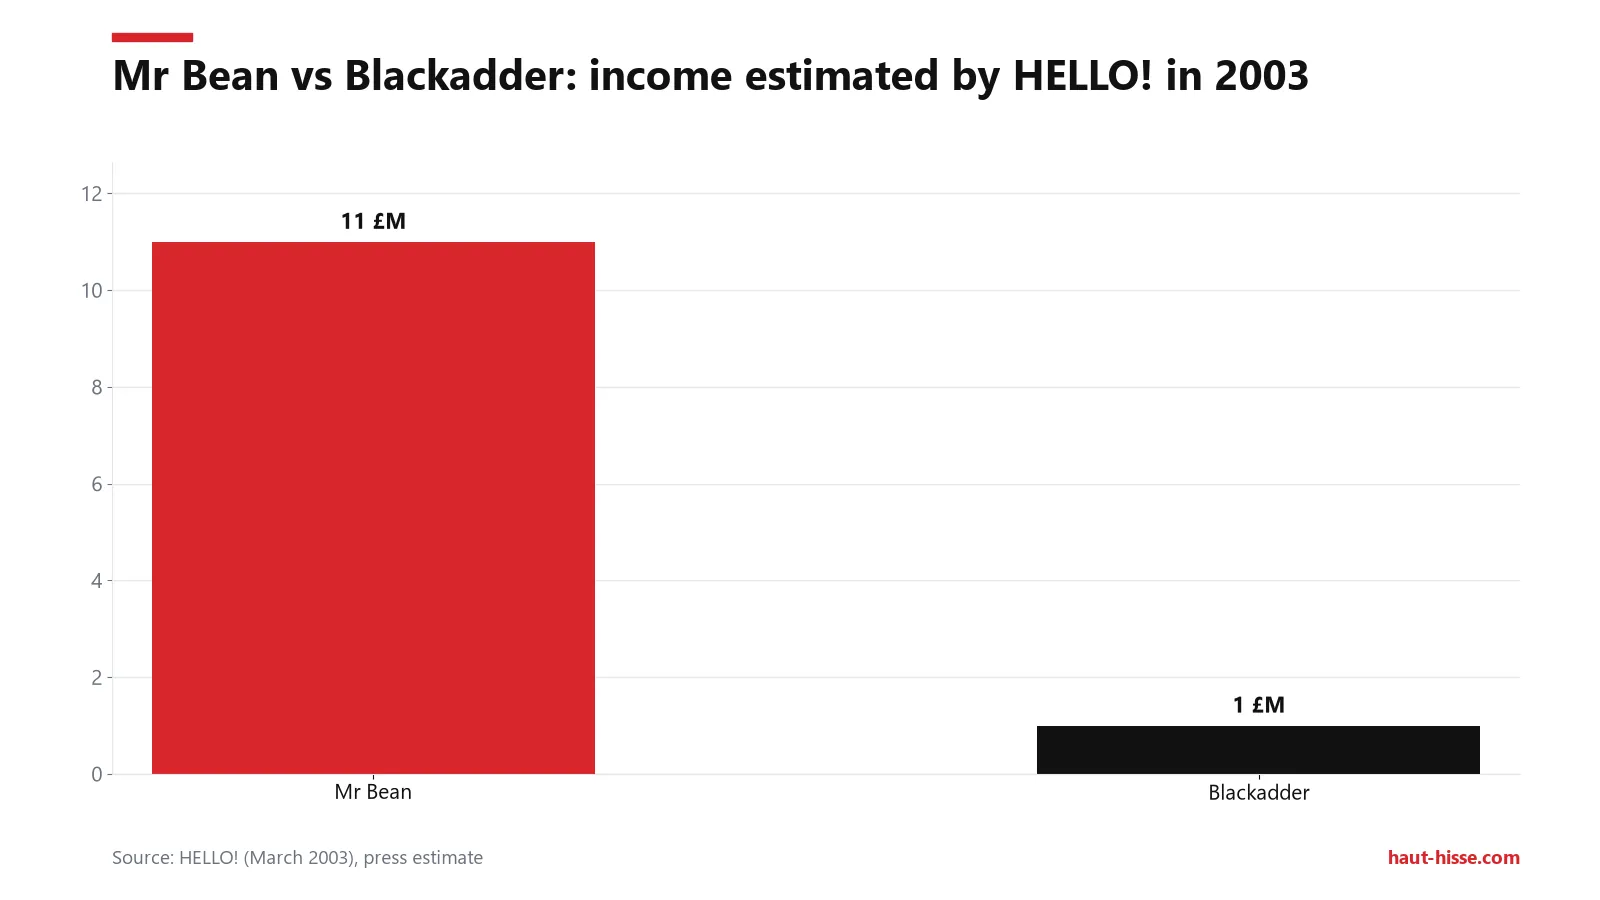
How much does Mr Bean earn? No official figure has been published for Rowan Atkinson’s earnings from Mr Bean. The best-known estimate is £11 million for the sale of the character in 2003, reported by HELLO! magazine. It is a press estimate, not a number from published accounts, and it does not show what the actor personally received.

Key takeaways

  • No official figure for Mr Bean’s earnings has been published.
  • The main estimate, a press figure for the sale of the character, was reported by HELLO! in 2003.
  • The original series has only 14 episodes, yet it has been sold in more than 190 countries.
  • The two Mr Bean films grossed about $483 million combined, according to Box Office Mojo (Bean, Mr. Bean’s Holiday). Box office is ticket sales, not the actor’s fee.
  • Banijay Kids & Family holds the licensing and merchandising rights; Atkinson’s current share is not public.

The press has put a figure on the character’s sale. Two films each grossed more than $230 million worldwide, Bean and Mr. Bean’s Holiday, according to Box Office Mojo, and UK company accounts are worth checking.

A nearly silent character, a very short original series, and sketches shot more than thirty years ago: on paper, the model looks fragile. It isn’t, because these clips still circulate everywhere, from TV channels to YouTube. This analysis reviews press estimates, the catalogue, online audience, box office, licensing, and the filings at Companies House, the UK company register.

Key dates

  • 1990-1995: 14 live-action episodes broadcast on ITV, according to Chortle;
  • 1997: release of Bean, with a worldwide gross listed by Box Office Mojo;
  • 2002: animated series begins, according to Wikipedia;
  • 2003: HELLO! publishes a press estimate of the character’s sale;
  • 2007: release of Mr. Bean’s Holiday, with a worldwide gross listed by Box Office Mojo;
  • 2018: the official YouTube channel passes a major subscriber milestone, according to Chortle;
  • 2020: series sold in more than 190 countries, according to Televisual.

1990-1995: only 14 episodes, a very short catalogue

The original live-action series has 14 episodes, broadcast on ITV between 1990 and 1995, according to Chortle. That is the answer to the question people ask most often about the show.

This tiny stock contrasts with how long the income has lasted: more than thirty years after the first broadcasts, the character is still being exploited. The catalogue has not grown, though. An animated series has existed since 2002, according to Wikipedia, but it adds to the offer without changing the original series.

The confusion is common because three things circulate under the same name:

  • the 14 original episodes, filmed with Rowan Atkinson;
  • the animated sketches, produced from 2002;
  • online clips, meaning scenes cut from those two sets.

An “episode” watched on YouTube is therefore often a single scene, not an extra episode. For earnings questions, the distinction matters: each product has its own sales channel.

2003: when the press valued Mr Bean at £11 million

In March 2003, HELLO! magazine credited Mr Bean with a major share of Rowan Atkinson’s fortune.

According to HELLO! (2003), Mr Bean earned Atkinson £11 million versus £1 million for Blackadder.
Mr Bean vs Blackadder: income estimated by HELLO! in 2003 — Source: HELLO! (March 2003), press estimate

The profile was published on 20 March 2003. The magazine described Atkinson as Britain’s richest television star, with a fortune estimated at about £60 million, according to HELLO!. The same text says the sale of the character in around 94 countries would have brought the actor £11 million. It also offers a comparison: Blackadder, Atkinson’s other major TV success, would have earned about £1 million. The gap is more than ten to one in favour of Mr Bean.

This figure is a press estimate. It does not come from published accounts, and it does not state the period covered or the method of calculation. The actor’s fortune, for its part, remains an estimate, not a verified asset.

Why having almost no dialogue made Mr Bean so easy to export

Because Mr Bean says very little, the series sells without heavy dubbing. Wikipedia writes that this minimal dialogue “has allowed the series to be sold worldwide.”

A standard sitcom has to be translated, adapted and sometimes rewritten for local humour. A pantomime scene needs none of that: the same content serves every market, and adaptation costs stay low.

The reach is documented. In September 2020, the live-action series and seasons 1 to 3 of the animated series had been sold in more than 190 countries, with Latvia the most recent addition, according to Televisual. That matches HELLO!’s 2003 estimate, which already mentioned 94 countries.

One limit remains. Being sold in 190 countries says nothing about the price of each sale. A broadcaster in a small market does not pay what a major network pays, and the share that goes to the actor depends on contracts that are not public.

YouTube: how much does Mr Bean earn on the platform?

No official YouTube earnings have been published for Mr Bean. The audience is known, though, and it is large, which is what makes the stakes clear.

In 2020: 98 million subscribers on Facebook, 30 on YouTube, 8 on TikTok and 2 on Instagram.
Mr Bean’s combined subscribers by platform in 2020 — Source: Televisual (Sept. 2020)

The official channel reached 10 million subscribers on 29 October 2018, according to Chortle, which noted that very few channels had reached that mark. It started with clips from the 14 original episodes, and animated sketches were added later. Its most-viewed video, a hospital scene, was approaching 105 million views at the time.

Two years later, Televisual counted about 30 million YouTube subscribers across three channels, for more than 11 billion cumulative views. Across all platforms, subscribers exceeded 137 million: 98 million on Facebook, 2 million on Instagram and 8 million on TikTok. The brand’s two mobile games had 58 million downloads in six years.

These figures measure an audience, not revenue. Advertising income depends on the viewer’s country, the format and the platform’s terms. Above all, the share that goes to Rowan Atkinson, compared with producers and rights holders, is not documented anywhere.

1997 and 2007: how much did the Bean and Mr Bean’s Holiday films earn?

The two films together total about $483 million in worldwide box office, according to Box Office Mojo (Bean, Mr. Bean’s Holiday). These are box office figures, meaning tickets sold, not Atkinson’s earnings.

The table reproduces the Box Office Mojo data.

Film Year Worldwide total International share
Bean 1997 $251,212,670 82%
Mr. Bean’s Holiday 2007 $232,227,857 85.7%

Adding the two totals gives $483,440,527. In both cases, most of the gross comes from abroad: the United States contributes little, which fits the export argument. Holiday was in cinemas from 22 March 2007 to 19 January 2008.

Atkinson’s fee for Holiday is not documented, and no reliable figure is known. Much of the gross goes to cinemas, distributors and producers before it reaches a performer. Multiplying the total by an assumed percentage would only produce an invented number.

Who owns the Mr Bean rights: licensing, plush toys and games

Banijay Kids & Family holds the worldwide licensing and merchandising rights to the Mr Bean brand. That company, not the actor, therefore runs the exploitation of merchandise, according to Banijay.

In May 2024, Banijay announced three licensing agents: Bulldog in the United Kingdom, WP Brands in Australia and New Zealand, and Black White Orange in the Indian subcontinent. The company also announced a Steiff Mr Bean teddy bear, published by Danbury Mint for the United States, Germany and the United Kingdom.

The principle is that a brand lends its image to manufacturers and distributors. This differs from a retailer’s business, as described in the analysis of how Costco makes money. The two mobile games mentioned above follow the same brand logic.

These facts do not say whether Atkinson still receives a share of this licensing income, or how much. The contracts are not public.

What the filings at Companies House show

UK registers confirm that companies linked to the Mr Bean universe exist. Profit and dividend figures should be read in the filed documents: they are a line of verification, not a figure in themselves.

Hindmeck Limited (company no. 01809198) was incorporated on 16 April 1984. It is active, its business activity code is SIC 90030 (“creative arts”), and its latest accounts run to 30 April 2025, according to Companies House. It filed “total exemption full” accounts every year from 2017 to 2026, the latest on 30 January 2026, according to its filing history. The link between this company and Atkinson comes from press articles and does not appear in the accounts themselves.

Tiger Aspect Films Limited (company no. 02950699), incorporated on 20 July 1994, was named MR BEAN LIMITED from 18 August 1994 to 28 August 1996, according to Companies House. Its latest accounts run to 31 December 2023.

In March 2006, Chortle reported that the sale of Tiger Aspect, a company Atkinson co-owned, could earn him up to £4.5 million. The buyout by TWI was then valued at £30 million. That sum does not concern Mr Bean alone: the article does not mention the character.

Rowan Atkinson’s wealth, and why the figures differ

The two press estimates date from 2003, for HELLO!, and 2006, for Chortle.

In March 2006, Chortle put Atkinson’s fortune at £55 million, without mentioning Mr Bean, compared with about £60 million according to HELLO! in 2003. The gap between the two figures is probably explained by unpublished methods: assets counted, exchange rates, and the valuation of company shares. This is a hypothesis, since neither publication details its calculation. For another example of figures that look precise without being so, see the analysis of why prices end in 99.

Is Mr Bean a billionaire? No. The estimated fortunes remain in the tens of millions of pounds.

What the whole picture shows is that a small catalogue with almost no dialogue, sold across the world, can produce lasting income. The actor’s exact share remains unknown. No official earnings are published, estimates date quickly, and nothing details how revenue is split between producers, broadcasters and rights holders.

Frequently asked questions

How many Mr Bean episodes actually exist?

Fourteen, all broadcast on ITV from 1990 to 1995. The animated series, launched in 2002, adds its own sketches. Clips published online are not new episodes.

Does Rowan Atkinson still receive rights from Mr Bean?

No public document says so. Banijay Kids & Family holds the worldwide licensing and merchandising rights, but the contracts with Atkinson are not published. Any figure claimed for his current income would therefore be guesswork.

How much did Rowan Atkinson earn for Mr Bean’s Holiday?

His fee is not documented. The film grossed $232,227,857 worldwide, but that box office figure is shared between cinemas, distributors and producers. It does not measure the actor’s pay.

Is Mr Bean a billionaire?

No. The press estimates, published by HELLO! in 2003 and by Chortle in 2006, cover tens of millions of pounds. Those figures refer to the actor, not the character.

Why is Mr Bean broadcast in more than 190 countries?

The character speaks very little, which avoids dubbing and heavy adaptation. Wikipedia says this minimal dialogue has allowed the series to be sold worldwide. More than 190 countries had bought it by 2020, according to Televisual.

Sources

  1. Rowan Atkinson: fortune and Mr Bean sales — HELLO! (2003)
  2. Funny money: Rowan Atkinson’s fortune and the Tiger Aspect sale — Chortle (2006)
  3. Mr Bean hits 10 million YouTube subscribers — Chortle (2018)
  4. Mr Bean: audience and sales in 2020 — Televisual (2020)
  5. Bean (1997) — Box Office Mojo (2026)
  6. Mr. Bean’s Holiday (2007) — Box Office Mojo (2026)
  7. Banijay Kids & Family secures licensing agents and plush deal for Mr Bean — Banijay (2024)
  8. Hindmeck Limited, company profile — Companies House (2026)
  9. Hindmeck Limited, filing history — Companies House (2026)
  10. Tiger Aspect Films Limited, company profile — Companies House (2026)
  11. Mr. Bean (character) — Wikipedia (2026)

Prepared with the help of AI tools, then fact-checked and edited by the Haut-Hisse editorial team.

Why Concorde stopped flying: the chain of causes

0
Tail fin of Concorde G-BOAF, the last Concorde ever to fly, on display at Filton near Bristol
Photo: Adrian Pingstone / Wikimedia Commons, public domain

This is why Concorde stopped flying: a chain of causes, not a single event. The crash at Gonesse in 2000 forced the whole fleet to be grounded and led to costly modifications. Then falling revenue and rising maintenance costs pushed Air France and British Airways to announce its retirement on 10 April 2003.

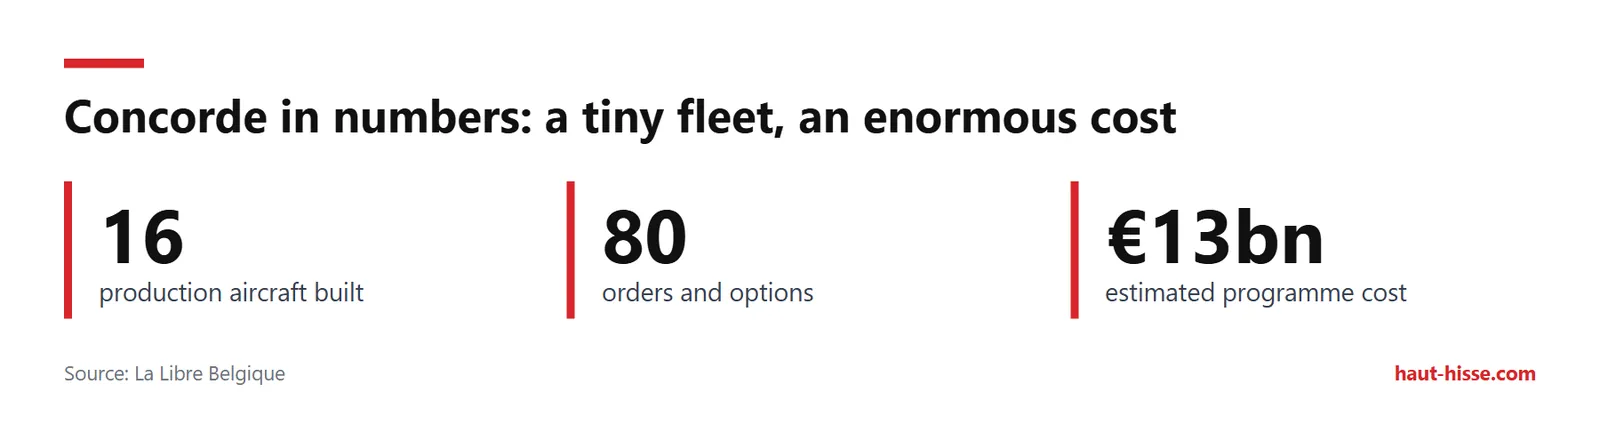
Only sixteen production aircraft, for a programme estimated at around 13 billion euros: well before 25 July 2000, Concorde stood on fragile financial ground. That detail changes how its end should be read, since it is so often reduced to a single crash. The article follows the timeline from the accident to the 2001 modifications and the airlines’ finances, and compares the competing accounts of how much each cause weighed.

Key takeaways

  • The Gonesse crash (25 July 2000, 113 deaths) started the chain, but it did not decide the grounding on its own.
  • On 5 September 2001, the British and French authorities imposed seven modifications. Service resumed on 7 November 2001.
  • On 10 April 2003, Air France and British Airways cited falling revenue and rising maintenance costs.
  • Airbus, which held the airworthiness certificate, did not want to keep supporting the aircraft after October 2003. Accounts differ on how much weight that refusal carried.

Why Concorde stopped flying: a small fleet and an expensive program

Only 16 production aircraft were built. The program was very costly, and its business model was fragile even before the crash.

Key figures: 16 production aircraft for 80 orders and options, programme cost about 13 billion euros.
Concorde in numbers: a tiny fleet, an enormous cost — Source: La Libre Belgique

According to La Libre Belgique, the program looked like this:

Item Figure Source
Production aircraft 16 La Libre Belgique
Prototypes and development aircraft 2 prototypes and 2 development aircraft La Libre Belgique
Orders and options 80 aircraft La Libre Belgique
Program cost About €13 billion (€20 billion according to historian Claude-Alain Sarre) La Libre Belgique

The program’s cost is therefore estimated at about €13 billion, according to La Libre Belgique, for just 16 production aircraft.

The market closed early. According to L’Essentiel de l’Éco, Pan Am and TWA cancelled their options on 31 January 1973. On 27 March 1973, the Federal Aviation Administration (FAA), the US civil aviation authority, banned civil supersonic flights over US territory. The same outlet adds a “protectionist” reading. That interpretation has not been demonstrated and remains an opinion, not a fact.

The Gonesse crash in 2000: what happened?

On 25 July 2000, Air France’s Concorde F-BTSC, charter flight AFR 4590 to New York, crashed at Gonesse shortly after takeoff from Roissy-Charles-de-Gaulle.

The Bureau d’Enquêtes et d’Analyses (BEA), France’s agency for investigating air accidents, puts the death toll at 113: 100 passengers, 9 crew members and 4 people on the ground.

Authorities reacted quickly. According to a summary of the report published by Migflug Afterburner, a joint recommendation from the BEA and the Air Accidents Investigation Branch (AAIB), the British accident investigator, led to the suspension of the individual airworthiness certificates of all Concordes on 16 August 2000. That suspension grounded the entire fleet.

The table below gives the timeline for the day of the accident (local time), as summarized by Migflug Afterburner. V1 is the decision speed: beyond it, the takeoff is normally no longer aborted.

Time Event Source
16:42:31 Start of takeoff roll Migflug Afterburner (summary of BEA report)
16:43:03.7 V1 speed Migflug Afterburner (summary of BEA report)
16:43:13.4 Fire alert transmitted by the tower Migflug Afterburner (summary of BEA report)
16:43:21.9 Takeoff Migflug Afterburner (summary of BEA report)
16:44:31.6 End of the cockpit voice recording Migflug Afterburner (summary of BEA report)

BEA report findings: the technical chain behind the accident

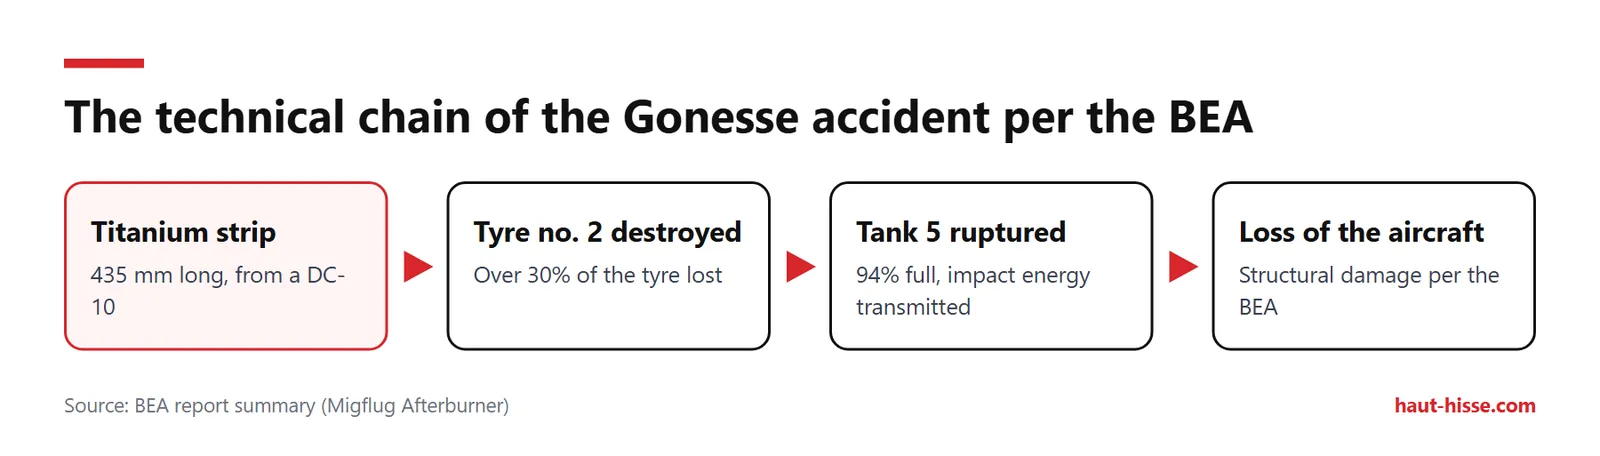
According to the BEA, a metal strip that fell onto the runway destroyed a tyre, and a piece of that tyre ruptured fuel tank 5. This is the technical cause of the accident, separate from the causes of Concorde’s retirement.

4-step chain: 435 mm strip, tyre no. 2 destroyed, tank 5 (94% full) ruptured, loss of the aircraft.
The technical chain of the Gonesse accident per the BEA — Source: BEA report summary (Migflug Afterburner)

According to the summary of the report published by Migflug Afterburner, the chain unfolded as follows:

  1. A titanium strip from a Continental Airlines DC-10 remained on the runway. It measured 435 mm long, 29 to 34 mm wide and about 1.4 mm thick.
  2. Concorde’s No. 2 tyre was destroyed. More than 30% of the tyre was lost.
  3. A piece of tyre struck fuel tank 5, which was about 94% full. The BEA ruled out direct puncture: the tank ruptured because the impact energy was transmitted through the structure.
  4. According to the BEA, as cited by Migflug Afterburner, the structural damage to the aircraft would have led to its loss.

According to the same summary, the BEA also found that the strip had been neither manufactured nor installed in line with the manufacturer’s procedures.

One point remains disputed. Migflug Afterburner reports that the BEA considers the hydrodynamic pressure wave (a pressure wave in the fuel caused by the impact) a contributing factor only, and not sufficient on its own. The British accredited representative disagreed with this separation of mechanisms.

The BEA published five investigation documents:

Date Document
1 September 2000 Preliminary report
15 December 2000 First interim report
23 July 2001 Second interim report
19 December 2001 Final meeting of the inquiry commission
16 January 2002 Final report

Courts later settled liability. In 2010, the Pontoise court sentenced Continental to a €200,000 fine and €1 million in damages. On 29 November 2012, the Versailles Court of Appeal acquitted the airline of criminal charges. However, it found Continental civilly liable and ordered it to pay Air France €1 million for damage to its image, based on the chain that began with the strip.

The final report in French is the authoritative version. For detailed conclusions and recommendations, see the BEA’s official report.

The 2001 safety modifications and the return to service in November 2001

On 5 September 2001, the UK Civil Aviation Authority (CAA) and France’s Direction générale de l’Aviation civile (DGAC) imposed seven modifications. Concorde resumed commercial service on 7 November 2001.

The CAA is Britain’s civil aviation regulator. The DGAC is its French counterpart. According to Heritage Concorde, they issued airworthiness directives that day. These are mandatory orders requiring a modification, sent to airlines and manufacturers. The seven measures were:

  • a Kevlar (a very strong synthetic fibre) liner in the tanks;
  • Michelin tyres with the NZG reference on the eight main wheels;
  • shielding of the landing gear wiring;
  • removal or reshaping of the water deflector, the part in front of the wheels that diverts water off the runway;
  • a revised anti-skid procedure;
  • tyre-deflation detection;
  • cutting off the brake fans during takeoff and landing.

According to the same source, these measures were tested before the return to service:

Date Test or decision Source
May 2001 Testing of the NZG tyres on F-BTSD Heritage Concorde
16 July 2001 Supersonic check flight of G-BOAF (British Airways), between Heathrow and the RAF base at Brize Norton Heritage Concorde
5 September 2001 CAA and DGAC airworthiness directives Heritage Concorde
7 November 2001 Resumption of commercial service Futura-Sciences

According to Air France, as quoted by Futura-Sciences, maintenance costs have risen “very sharply since the supersonic was returned to service.” This is the first economic link in the chain. The modifications made the aircraft safer, but operating it cost more.

The impact of September 11, falling business travel and maintenance costs

After the return to service, business travel declined and maintenance costs rose. Air France described an operation that had become loss-making.

The impact of September 11

Concorde returned to service in the aftermath of 11 September 2001, a period marked by weaker demand for premium travel. British Airways also cited a global drop in that demand to justify its withdrawal. The exact share of the attacks in this decline has not been quantified, and it would be misleading to assign them a specific portion.

Rising maintenance costs

According to Futura-Sciences, Air France says maintenance costs have risen “very sharply” since November 2001. The same source reports that the airline considered the operation to be “heavily and structurally loss-making.”

Falling business travel

According to Futura-Sciences, Air France also pointed to “a drop in business travel that particularly weighed on Concorde’s results.” Its chairman and CEO, Jean-Cyril Spinetta, judged that continuing operations was “unreasonable.”

Was Concorde profitable?

Not in its final years, according to the airlines. The available data are summarized below:

Indicator Figure Source
Seats sold by British Airways before the 2003 announcement A little under half Heritage Concorde (citing The Times)
Seats sold by Air France before the 2003 announcement About a fifth Heritage Concorde (citing The Times)
BA cabin refurbishment during the grounding £14 million Heritage Concorde
Write-down booked by BA, year ended March 2003 £84 million Aerocorner
Maintenance needs estimated by Airbus over 2 to 5 years £40 million Heritage Concorde (citing The Times)

For every ten seats offered, that works out to fewer than five sold at BA and two at Air France. BA had also pointed to the global fall in premium demand.

For a broader look at margins and fixed costs, another Haut-Hisse article explains Costco’s business model.

The 10 April 2003 announcement and Airbus’s role: who made the decision?

On 10 April 2003, Air France and British Airways announced the retirement of their Concordes. Airbus, which held the airworthiness certificate, did not want to keep supporting the aircraft beyond October 2003.

Both airlines gave the same reasons: falling passenger revenue and rising maintenance costs, according to Heritage Concorde. According to The Times, as cited by that source, Airbus refused to transfer the certificate and had estimated maintenance needs at £40 million over two to five years.

Accounts differ on who really made the decision. BA first presented it as a joint decision. Air France said it had been taken in close consultation with Airbus. BA’s chairman, Lord Marshall, told The Times that his airline would have preferred to continue if the French partner had shared the extra maintenance cost.

Two levels need to be kept apart. What is established: the joint announcement, the reasons given, and Airbus’s refusal as reported by the press. What belongs to analysis: the relative weight of each cause. The documents cited do not allow it to be measured precisely.

Concorde’s last flight dates

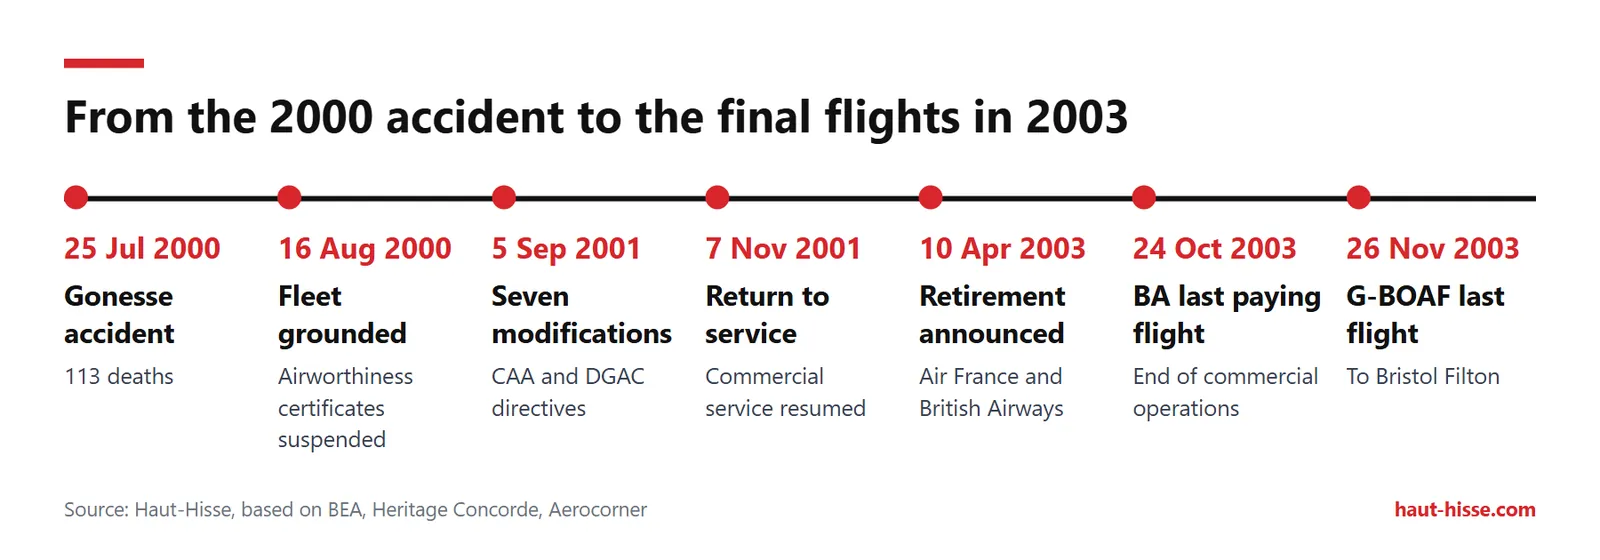
Air France flew its last service on 30 May 2003. British Airways flew its last paying flight on 24 October 2003, and G-BOAF flew for the last time on 26 November 2003.

Timeline of 7 dates, from the 25 July 2000 crash to the G-BOAF's last flight on 26 November 2003.
From the 2000 accident to the final flights in 2003 — Source: Haut-Hisse, based on BEA, Heritage Concorde, Aerocorner

The operating dates rely on Aerocorner.

Date Event Source
10 April 2003 Retirement announced by Air France and British Airways Heritage Concorde
30 May 2003 Last Air France service Aerocorner
24 October 2003 Last paying British Airways flight Aerocorner
26 November 2003 Last flight of G-BOAF, to Bristol Filton Aerocorner

One discrepancy exists for Air France: its last flight was announced for 31 May, and sources vary between 30 and 31 May.

Did the crash cause the retirement? Disagreements over the main cause

The crash was the trigger for a chain of causes, but not the single explanation. Analyses differ on the weight of the accident, the economics and Airbus’s refusal.

The most defensible ranking follows chronological order:

  1. the technical cause of the accident, established by the BEA;
  2. the modifications imposed in 2001, which made operations more costly;
  3. the decline in profitability and business travel;
  4. the 2003 decision and Airbus’s refusal to support the aircraft.

A contrary view exists. L’Essentiel de l’Éco argues that the retirement was economically unavoidable, with a break-even point of about 130 sales according to the article. For this outlet, Airbus’s refusal to renew or transfer the certificate was decisive, and the accident was not the main cause. This is a media thesis, not an established fact.

Could Concorde have kept flying? BA said it wanted to continue if the costs were shared, while Airbus refused to support the aircraft after October 2003. Everything therefore depended on an agreement over the certificate and on funding maintenance.

Two questions should be kept apart: the cause of the accident (the strip, according to the BEA) and the causes of the retirement (costs, revenue, the certificate). On how prices and margins can obscure costs, see why prices end in 99.

Frequently asked questions

Why couldn’t Concorde fly over the United States?

The FAA banned civil supersonic flights over US territory on 27 March 1973, according to L’Essentiel de l’Éco. Concorde therefore could not fly at supersonic speed over US land. The “protectionist” reading of that decision has not been demonstrated.

How many Concordes were built?

Sixteen production Concordes were built, after 2 prototypes and 2 development aircraft, according to La Libre Belgique. The program had 80 orders and options. According to the same source, its cost is estimated at about €13 billion.

When was Concorde’s last commercial flight?

British Airways flew its last paying flight on 24 October 2003, according to Aerocorner. Air France ended its operations on 30 May 2003, a date some sources place on 31 May. G-BOAF flew for the last time on 26 November 2003.

Could Concorde fly again?

That would require overcoming the obstacles described above: an airworthiness certificate held by Airbus, which refused to transfer it in 2003, and high maintenance costs. Restoring an aircraft this complex would also require industrial backing.

Sources

  1. Accident to the Concorde registered F-BTSC operated by Air France — BEA (2002)
  2. Final report F-SC000725 — BEA (2002)
  3. Air France 4590: the Concorde crash at Gonesse — Migflug Afterburner (n.d.)
  4. CAA and DGAC modifications — Heritage Concorde (2001)
  5. Concorde retirement — Heritage Concorde (2003)
  6. Concorde: the end of a great adventure — Futura-Sciences (2003)
  7. Why did Concorde stop flying? — Aerocorner (n.d.)
  8. The beginning of a myth — La Libre Belgique (2003)
  9. The death of Concorde: twenty years of lying by omission — L’Essentiel de l’Éco (2026)
  10. Concorde crash: Continental Airlines acquitted but must pay compensation — Webmanagercenter (2012)

Prepared with the help of AI tools, then fact-checked and edited by the Haut-Hisse editorial team.
Why prices end in 99: What research actually shows

1
Red shopping basket on the concrete floor of a supermarket

Understanding why prices end in 99 comes down to left-digit bias, a cognitive tendency to focus heavily on a number’s first digit. When shoppers see a price like €2.99, they read it as closer to €2 than to €3. However, research shows this effect varies widely depending on product type, brand positioning, and discount context.

Key takeaways

  • According to Thomas and Morwitz (2005), the left-digit effect occurs when the leftmost digit changes (such as $2.99 to $3.00), as the first digit anchors attention.
  • A 2024 meta-analysis found a positive but small and highly variable effect of 9-endings on consumer purchases.
  • Ending a price in 9 is less effective alongside a “Sale” tag and can discourage shoppers from upgrading to higher-tier products.
  • In luxury retail, prices ending in 50 or 80 serve as alternatives to 99, while the historical theory tied to preventing register theft remains unproven.

Why prices end in 99: The left-digit effect

Left-digit bias refers to the cognitive tendency to focus attention on the first digit of a number while partially ignoring subsequent digits. This psychological mechanism is the primary explanation for why consumers perceive a price ending in .99 differently from a rounded price just one cent higher. However, the magnitude of this effect remains debated: several replication studies found no effect, and a recent meta-analysis concluded the overall impact is small.

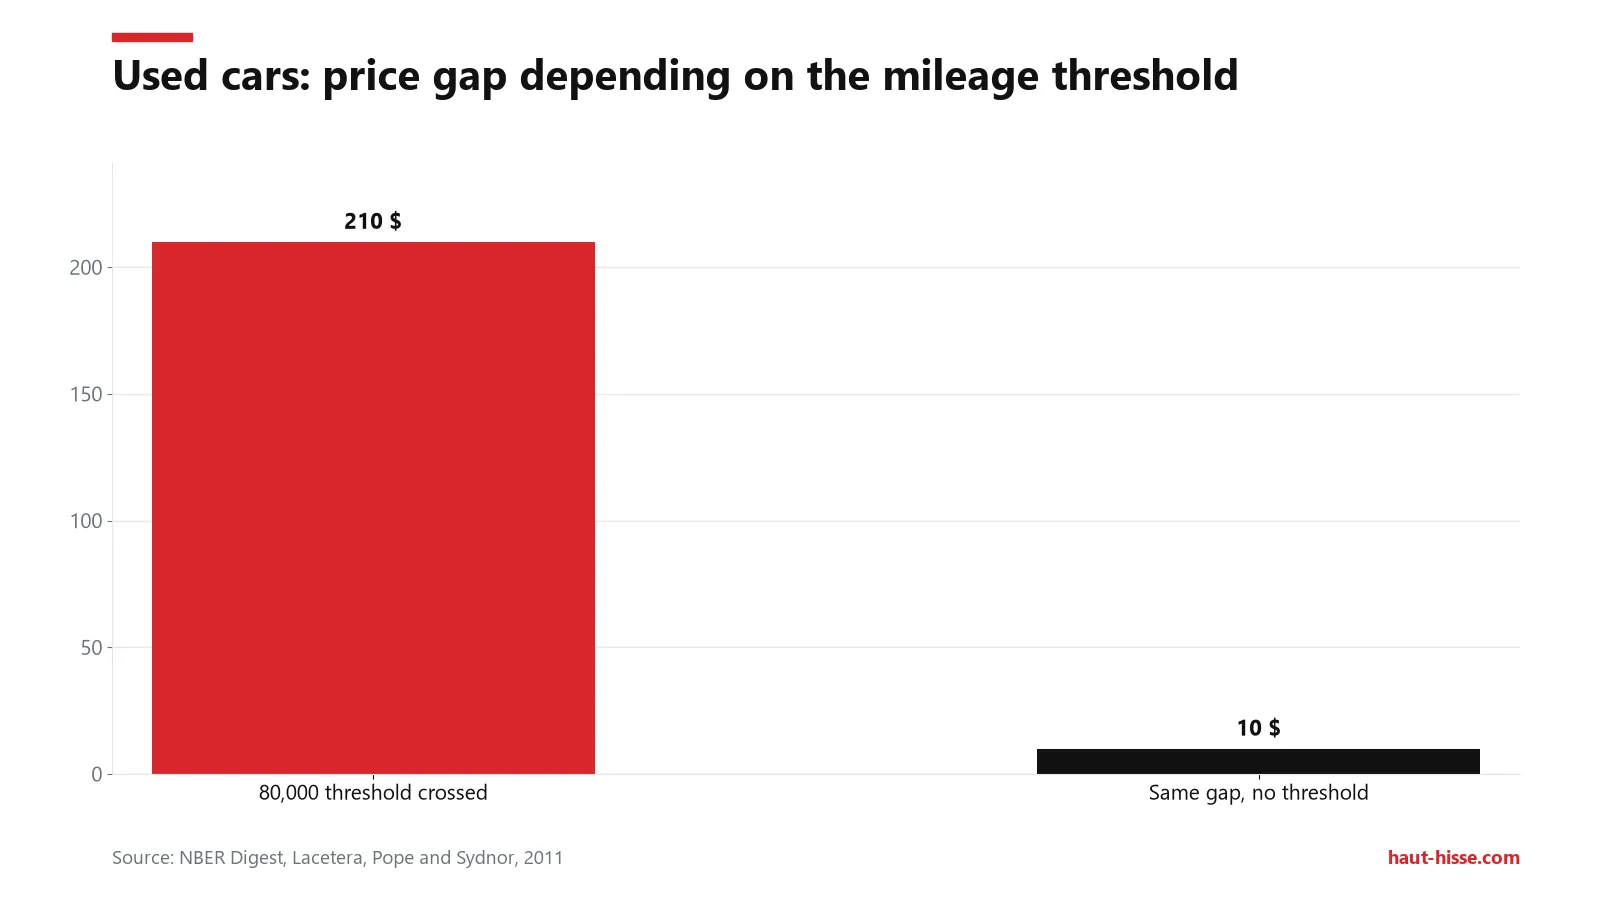
A car at 79,900–79,999 miles sells for about $210 more than at 80,000–80,100 miles, but only $10 less than at 79,800–79,899.
Used cars: price gap depending on the mileage threshold — Source: NBER Digest, Lacetera, Pope and Sydnor, 2011

This phenomenon is detailed in research by the National Bureau of Economic Research (NBER), which analyzed left-digit bias beyond retail price tags. Across more than 22 million used-car auction sales in the United States, sale prices dropped sharply at each 10,000-mile threshold—by roughly $150 to $200 per threshold.

The price differences observed around these boundaries illustrate the effect:

Comparison (mileage in miles) Observed price difference
79,900–79,999 vs. 80,000–80,100 Roughly $210 higher for the former
79,900–79,999 vs. 79,800–79,899 Roughly $10 lower for the former

The mileage difference is comparable in both cases, but only the first crosses a boundary where the leftmost digit changes.

Writing in the Journal of Consumer Research, Thomas and Morwitz demonstrated through five experiments that this perceptual distortion occurs only when the leftmost digit changes, such as between $2.99 and $3.00. The effect grows stronger when the two compared prices are close to one another. It is not limited to pricing and appears across other multi-digit numbers as well.

Left-to-right reading: Price underestimation or “round price minus a bit”?

Two competing hypotheses explain why 9-endings are so widespread, though field data primarily supports the second.

In 1997, Schindler and Kirby noted in the Journal of Consumer Research that ending digits 0, 5, and 9 were overrepresented in retail advertisements. They attributed 0- and 5-endings to the cognitive accessibility of round numbers. For 9-endings, they offered two potential explanations:

  • Consumers view the price as a round figure minus a small amount (such as one cent).
  • Consumers read numbers incompletely from left to right and retain the first round digit encountered, leading them to underestimate the total price.

Observed digit patterns largely support the second hypothesis.

This cognitive processing contrasts with how consumers evaluate round prices. Wadhwa and Zhang showed across five studies in the Journal of Consumer Research that round prices are processed more fluently, encouraging feel-based evaluations, whereas non-round prices prompt more analytical thinking.

In retail settings, Levy and co-authors established in the Review of Economics and Statistics (2011) that 9 is the most frequent ending digit across cents, dimes, dollars or euros, and tens. Their weekly scanner data and online price tracking also showed that 9-ending prices change less frequently than others. When they do change, the average price adjustment is larger.

Do $9.99 prices actually boost sales? Field and catalog evidence

Several field studies have observed a positive effect of 9-ending prices on demand, though the size of the impact varies by context.

Study Data Finding
Anderson and Simester (2003), Quantitative Marketing and Economics Three field experiments on catalog items Prices ending in 9 increased demand in all three experiments
List, Muir, Pope, and Sun (2023), The Review of Economic Studies 21 million Lyft riders, over 600 million sessions About half the slope of the demand curve concentrates at dollar thresholds (e.g., from $14.00 to $13.99)
Strulov-Shlain (2023), The Review of Economic Studies Scanner data from 25 US retail chains (~3,500 products) A one-cent price increase from a .99 price is perceived like a increase of over 20 cents

In the case of Lyft, the company did not use 99-cent pricing prior to the study. According to List and co-authors, if short-term effects persisted, adopting left-digit pricing could generate roughly $160 million in additional annual profits. Meanwhile, Strulov-Shlain estimated that studied US retailers forgo 1% to 4% of potential gross profit because their pricing rules react too coarsely to left-digit bias.

Regarding how common 9-endings are, Snir and Levy reported in a paper published via MPRA (2019) that 9-ending prices accounted for 40% to 95% of retail prices in scanner data from a major US chain (over 98 million observations). However, these findings come from a single chain and do not necessarily apply across all retail sectors.

By contrast, popular online articles often cite unnamed “studies.” A post by WiziShop, a French e-commerce platform (updated November 21, 2022), claimed a product priced at €1.99 converts “more than twice as well” as one priced at €2. The article cited no sales figures, methodology, or scientific source.

Varying effects by product and context: When 9-endings work, fail, or send a signal

The effectiveness of a 9-ending depends on consumer familiarity, product category, and promotional context.

The table below summarizes situations where 9-endings produce an effect, where that effect diminishes, and where brands opt for alternative price endings.

Retail context Impact of 9-ending Proposed mechanism or explanation Evidence level
New items Stronger effect than on existing products Authors suggest 9-endings work better when customers have limited price information Real catalog experiments (Anderson and Simester, 2003)
Items marked with a “Sale” sign Reduced effect 9-endings are less effective when retailers add explicit sale indicators Field experiments (Anderson and Simester, 2003)
Small price differences on expensive items; price-familiar shoppers No effect observed The threshold effect disappears in these contexts Study by Goodman, Ohio State, 2021
Upselling to a premium option Discourages upgrading Pricing just below a round threshold makes upgrading feel less appealing Seven experiments and campus coffee sales (Kim, Malkoc, and Goodman, 2021)
Luxury goods Prices ending in 50 or 80 rather than 99 or round figures Reduces anticipated purchase guilt and reinforces luxury positioning compared to 9-endings Experiment and regressions (Parguel, Fraccaro, and Macé, 2022)

These findings suggest the 9-ending effect cannot be generalized across all retail settings. In their catalog experiments, Anderson and Simester noted that order increases were significantly stronger for new items than for products sold in previous years.

Meta-analyses and failed replications: A real but small effect

Systematic reviews describe a positive but small and highly variable effect that shrinks further when adjusted for publication bias.

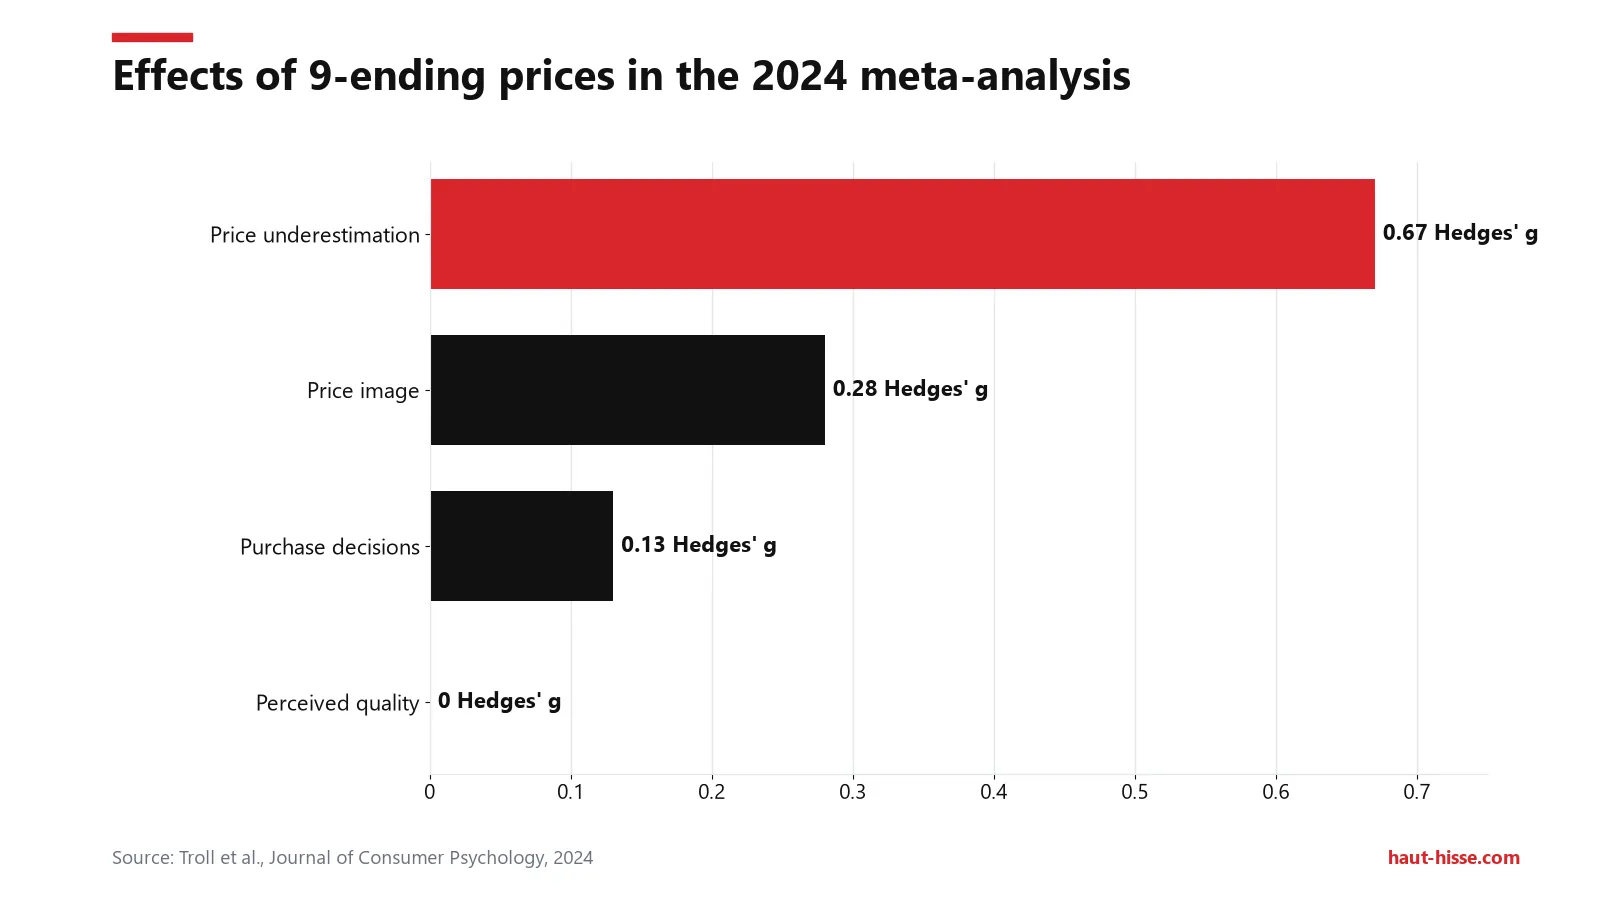
Hedges' g: underestimation 0.67, price image 0.28, purchase 0.13, perceived quality 0.00. Effects are small.
Effects of 9-ending prices in the 2024 meta-analysis — Source: Troll et al., Journal of Consumer Psychology, 2024

A pre-registered meta-analysis by Troll and co-authors published in 2024 in the Journal of Consumer Psychology compiled 69 studies (362 effect sizes, 40,541 participants) comparing “just-below” prices to round prices:

Outcome measure Effect size (Hedges’ g) Confidence interval
Purchase decisions g = 0.13 95%: 0.01 to 0.25
Price image g = 0.28 0.09 to 0.48
Price underestimation g = 0.67 0.04 to 1.30 (very wide)
Perceived quality g = 0.00 −0.17 to 0.18

Hedges’ g measures the standardized difference between two groups; a value of 0.13 represents a small effect.

The authors described the effects as small and highly heterogeneous. Their p-curve analyses revealed numerous non-significant findings, and publication bias corrections suggested true effect sizes are even smaller.

Several replication attempts mirror these conclusions:

  • PLOS ONE (2022): An online experiment involving 4,788 lottery ticket purchase decisions across 266 participants found support for neither the left-digit effect nor round-price fluency.
  • Data Colada (October 2020): A replication study evaluating a 2020 left-digit paper (original sample: 145 participants; replications: 1,099 and 1,555 participants) found an effect in the expected direction, but far smaller than originally reported. Detecting it reliably would require samples of 3,000 to 4,500 participants.

9-ending prices and quality perception: Bargain or cheap impression?

While 9-endings improve a store’s overall price image, their impact on perceived product quality depends on how quality is measured.

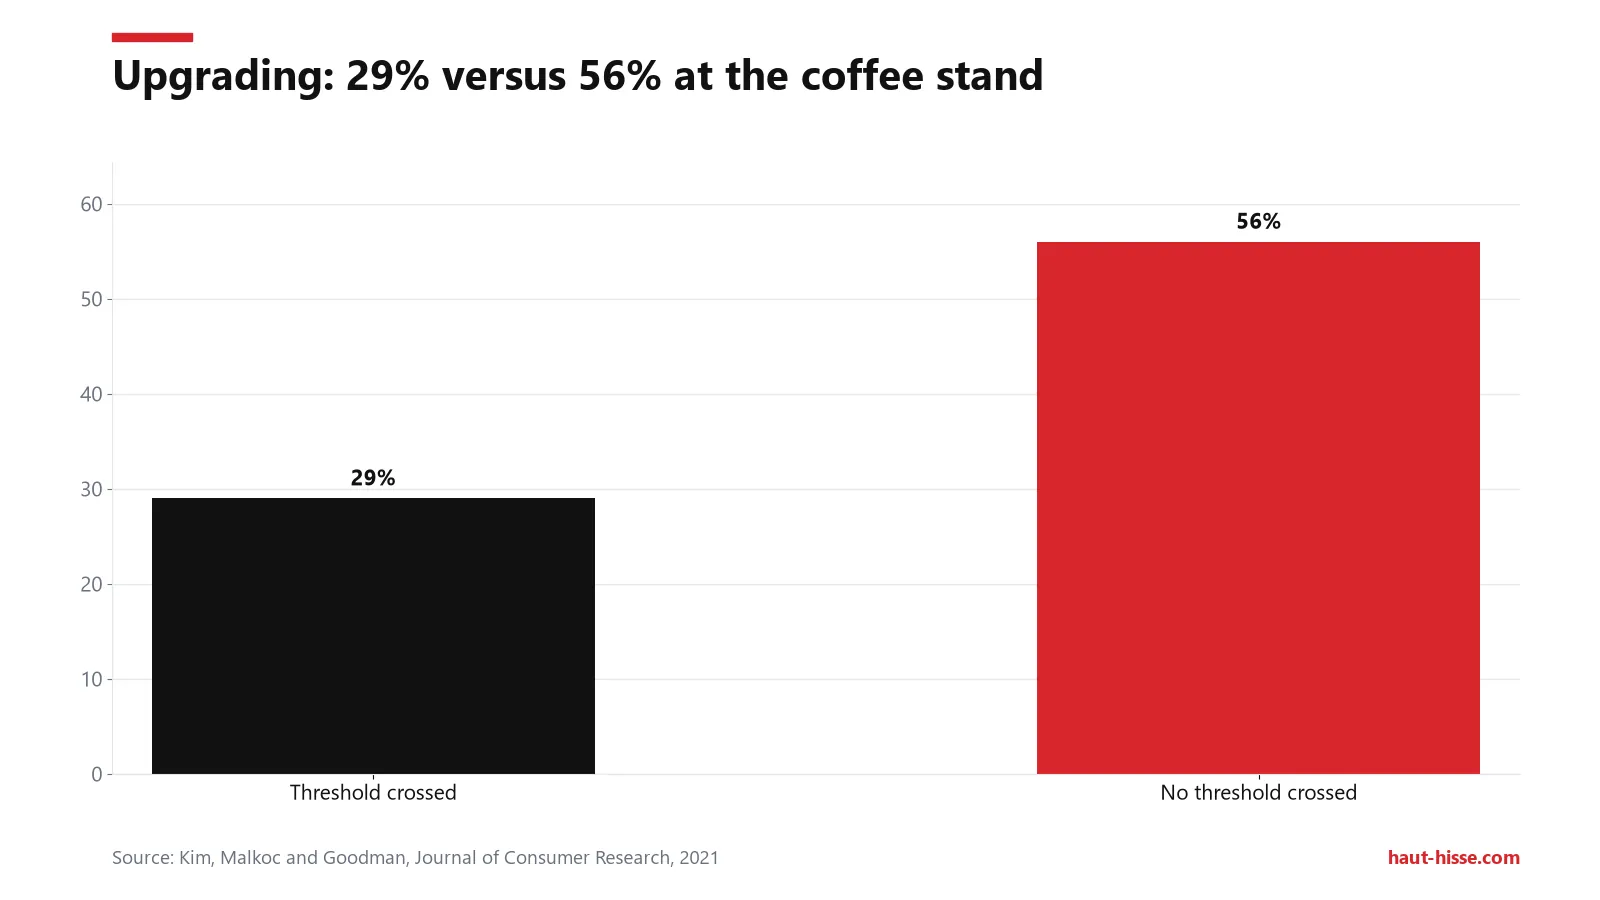
Share of customers choosing the large coffee: 29% when crossing the $1 threshold (0.95/1.20), 56% otherwise (1.00/1.25).
Upgrading: 29% versus 56% at the coffee stand — Source: Kim, Malkoc and Goodman, Journal of Consumer Research, 2021

Explicit measures in Troll’s meta-analysis showed zero overall effect on perceived quality (g = 0.00). In contrast, Seitz and colleagues used implicit measures (IAT and GNAT tests) across four pre-registered laboratory experiments published in the Journal of Revenue and Pricing Management (February 28, 2026). They found strong implicit associations between 9-ending prices, lower perceived quality, and a discount-oriented price image—contrasting with meta-analytic findings using explicit ratings.

The bargain reputation of 9-endings has a clear commercial grounding. Snir and Levy noted that among discounted items, 9-ending prices are indeed lower. They suggest these items were initially cheaper before being raised without consumers taking notice.

When products are not on sale, regular 9-ending prices are actually higher than non-9 prices—by up to 18%, according to Snir and Levy (2019).

Round prices in luxury, sales, and upselling: The limits of 99-endings

Charm pricing reaches its limits in luxury goods, alongside discount cues, and during product upselling.

Round prices in luxury: “Compromise pricing”

In the Journal of Product & Brand Management (2022), Parguel, Fraccaro, and Macé identified a strategy called “compromise pricing.” Retailers set prices ending in 50 or 80—especially in the upper hundreds (such as €950 or €980)—rather than using 99-endings or perfectly round numbers. Their research combined a luxury watch experiment with sales data regressions from two online luxury fashion retailers.

The authors found that 50- and 80-endings reduce anticipated buyer guilt compared to round prices, while preserving a premium brand image better than 9-endings.

Sales: When discount tags reduce the 9-ending advantage

Prices ending in 9 are less effective when retailers explicitly add “Sale” markers, according to Anderson and Simester. Adding a discount sign reduces the additional impact of the missing cent.

Discount retailers can structure their business models around different principles; for instance, see how Costco makes money.

Upselling: The 2021 coffee study

Setting an entry-level item’s price just below a round threshold can hurt sales of the larger or upgraded version. Kim, Malkoc, and Goodman demonstrated this in seven experiments reported by Ohio State University (August 26, 2021). At a campus coffee shop:

  • When a small coffee cost $0.95 and a large cost $1.20, fewer than half of customers chose the large cup.
  • When the small coffee was priced at $1.00 and the large at $1.25, a clear majority chose the large cup.

Although the price gap was identical ($0.25) in both scenarios, the first forced consumers to cross the $1.00 threshold when upgrading. Goodman noted that this backfire effect does not occur for minor price differences on expensive items or among consumers highly familiar with product pricing, such as frequent hotel bookers.

Historical origins and deceit claims: What the evidence shows

The popular story attributing 99-cent pricing to theft prevention at cash registers remains unverified.

According to retail lore attributed to early US department stores, odd pricing forced clerks to open the cash drawer to make change, preventing them from pocketing bills. Writing in The E-Sylum, a publication of the Numismatic Bibliomania Society (September 5, 2004), the editor noted that early cited examples “may well be urban legend” due to a lack of contemporary documentation.

Regarding consumer deception, the 2024 meta-analysis demonstrated that the net effect of charm pricing on purchase decisions is small. Meanwhile, Snir and Levy’s research showed that retailers sometimes raised 9-ending prices over time without consumers realizing it.

Practical tips: Reading a price without being led by the first digit

The following steps offer a practical framework for price evaluation based on the cited research:

  1. Read the cents portion of a price before focusing on the main dollar or euro figure.
  2. Compare full amounts down to the cent, particularly when prices cross round thresholds (e.g., $2.99 vs. $3.00).
  3. Check whether a promotional sign is present: research by Anderson and Simester indicates that 9-endings add little extra value when an item is already marked “Sale.”

Frequently asked questions

Why do prices end in 9?

Data collected by Levy and co-authors showed that 9 is the single most common ending digit in retail. Researchers attribute this prevalence primarily to left-to-right reading habits, which cause consumers to anchor on the first digit (see Schindler and Kirby, 1997).

When does 99-cent pricing fail?

It is less effective alongside “Sale” signs. The threshold effect also disappears for minor price differences on high-ticket items and among buyers familiar with standard market pricing. Additionally, pricing an entry-level item just under a round number can discourage customers from upgrading to a premium model.

What pricing structure do luxury brands prefer?

Parguel, Fraccaro, and Macé showed that luxury retailers frequently use prices ending in 50 or 80, particularly in upper-hundred ranges. These endings reduce buyer guilt compared to round prices while maintaining a higher brand positioning than 9-endings.

What does research say about prices ending in 9?

Field studies show that 9-endings can increase demand in specific scenarios, but a comprehensive 2024 meta-analysis rated the overall impact as small (g = 0.13) and highly variable across contexts.

Sources

  1. Left-Digit Bias in Used Car Auctions — NBER (2011)
  2. Penny Wise and Pound Foolish: The Left-Digit Effect in Price Cognition — Journal of Consumer Research (2005)
  3. Patterns of Rightmost Digits in Advertised Prices: An Examination of Nine-Ending Prices — Journal of Consumer Research (1997)
  4. Effects of $9 Price Endings on Retail Sales: Evidence from Field Experiments — Quantitative Marketing and Economics (2003)
  5. The Left-Digit Bias at Lyft — The Review of Economic Studies (2023)
  6. Strulov-Shlain study on left-digit bias — The Review of Economic Studies (2023)
  7. A Meta-Analysis on the Effects of Just-Below versus Round Prices — Journal of Consumer Psychology (2024)
  8. Investigating the Left-Digit and Rounding Effects on Financial Decision-Making — PLOS ONE (2022)
  9. Left-Digit Bias: A Very Large Replication — Data Colada (2020)
  10. Why 9-Ending Prices Are So Common — MPRA (2019)
  11. Price Rigidity and the 9-Ending Effect — Review of Economics and Statistics (2011)
  12. Ending Prices with 99 Can Backfire on Sellers — Ohio State University (2021)
  13. Implicit Evidence for Price-Ending Effects on Quality and Image Perceptions — Journal of Revenue and Pricing Management (2026)
  14. Compromise Pricing in the Luxury Sector — Journal of Product & Brand Management (2022)
  15. Psychological impact of prices ending in 99€ — WiziShop (2022)

Prepared with the help of AI tools, then fact-checked and edited by the Haut-Hisse editorial team.
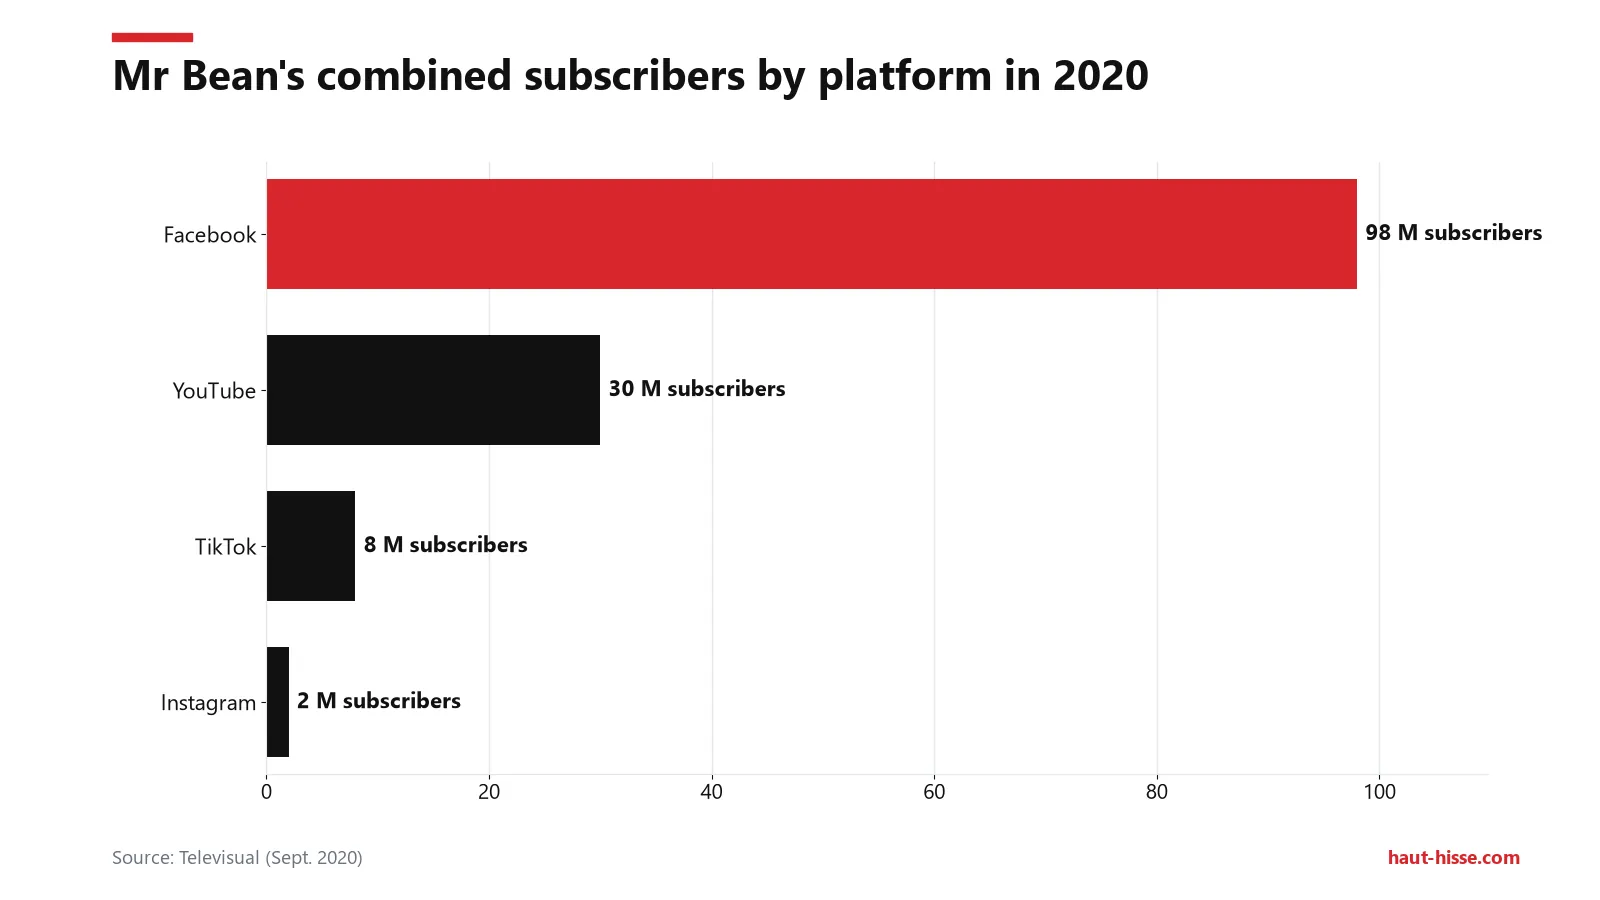
How Costco makes money: membership fees vs. retail aisles

1
Large wholesale warehouse store at golden hour, beige facade with a red stripe

Understanding how Costco makes money requires looking at its membership cards. According to the annual 10-K report for the fiscal year ended August 30, 2026, filed with the SEC, membership fees generated $5.907 billion—roughly 50.6% of operating income from just 1.9% of total revenue. Merchandise sales, sold at an 11.09% gross margin, generated roughly $5.8 billion.

Key takeaways

  • Membership fees accounted for about half of Costco’s operating income in its latest fiscal year, not almost all of it.
  • Warehouse merchandise sales remain profitable after purchasing costs and operating expenses.
  • Inventory is more than fully financed by accounts payable.
  • The fixed-price hot dog serves as a loss leader that drives customer retention.

How Costco makes money, line by line

In the latest fiscal year, Costco’s operating income split almost evenly between membership fees and the net operating profit from warehouse aisles.

Fees of $5,907m versus about $5,778m from merchandise: the $11,685m operating income is split almost evenly.
Where Costco’s operating income comes from ($m) — Source: Costco, FY2026 10-K annual report (Haut-Hisse calculation)

In 2024, CFO Gary Millerchip told investors, “I also want to confirm the $1.50 hot dog price is safe,” as reported by OPB/NPR. A statement about a hot dog price from an executive leading a company with over $300 billion in revenue highlights the question of where its profits actually come from.

Many analyses confuse the picture by mixing up revenue and net earnings. FinanceBuzz, for example, cites $4.8 billion in membership fees for fiscal year 2024, representing about 2% of revenue. The text provides neither the gross margin nor the share of profit, giving an order of magnitude without clarifying what cards contribute to the bottom line.

The 10-K annual report for the fiscal year allows that breakdown to be reconstructed. The editorial calculation begins with net sales and membership fees, then subtracts merchandise costs and selling, general, and administrative (SG&A) expenses.

Income statement line Amount ($M, latest fiscal year) Meaning
Net sales 297,247 What members pay at checkout
Merchandise costs 264,279 Purchase cost of goods sold
SG&A expenses 27,190 Wages, warehouses, operations
Warehouse merchandise profit about 5,778 Retail sales profit, editorial calculation
Membership fees 5,907 Membership card revenue
Operating income 11,685 Sum of merchandise profit and membership fees

Membership fees represent a very small percentage of total revenue but roughly half of operating income. Merchandise profits remain modest relative to net sales (editorial calculation). The common claim that Costco makes “almost no profit on warehouse sales” is therefore incomplete. Aisles deliver real profit, slightly lower than fee income.

Net income for the fiscal year increased markedly compared to 2025 (editorial calculation).

The 2024 fee increase: the model’s strongest lever

Membership fees form the core of Costco’s financial engine: $5.323 billion in 2025 and $4.828 billion in 2024, according to the fiscal 2025 10-K, following a price increase that took effect on September 1, 2024, in the United States and Canada. Fee revenue climbed again in the latest fiscal year.

Membership fee income has expanded by about a tenth each year, slightly outpacing net sales (editorial calculation).

The baseline fee remains low. According to the latest 10-K, annual membership rates vary by country and include a free card for a household member. Spread across the total paying member base, average fee revenue works out to a few dozen dollars per member annually (editorial calculation, accounting for higher-tier cards and international rates).

The relative weight of fees also shifts across the year. Over the first half of the fiscal year (24 weeks), The Motley Fool noted $2.68 billion in membership fees compared to roughly $2.4 billion in operating profit from retail sales. Over the full fiscal year, the gap narrows, with membership fees barely exceeding merchandise profits.

A renewal rate above 92% in North America

The renewal rate—the percentage of members who renew when their subscription expires—exceeds 92% in the United States and Canada and sits slightly lower worldwide, according to the latest 10-K.

This metric directly supports profitability: a renewed membership delivers fee revenue without customer acquisition costs. In the second quarter of the fiscal year, The Motley Fool reported a 92.1% renewal rate in North America, down 10 basis points year over year (one basis point equals 0.01 percentage points). Management attributed about one-third of membership fee growth at the time to the 2024 price hike.

Executive members account for 75% of sales

As of August 30, 2026, Costco counted 84.1 million paid members and 150.4 million cardholders, including 42.3 million Executive members, according to the fiscal year 10-K. Cardholder totals include free household cards.

Executive members carry substantial weight: they generated approximately 75.2% of worldwide net sales in the latest fiscal year, up from 73.6% in 2025. According to the 2025 10-K, they earn a 2% reward on eligible purchases, generally capped at $1,250 per year, and their membership costs an additional $65 in the United States. Customers paying more for their cards also spend the most in warehouses.

An 11% gross margin: Costco versus Walmart

Costco recorded an 11.09% gross margin on merchandise in the latest fiscal year, compared to 11.12% in 2025. That is less than half of Walmart’s gross margin, estimated at 24.2% by French financial market portal Zonebourse.

Costco's gross margin (11.12%) is less than half of Walmart's (24.2%), according to Zonebourse.
Gross margin: Costco 11.12% vs Walmart 24.2% — Source: Zonebourse

Gross margin reflects the portion of revenue remaining after purchasing goods, before paying operating expenses. For every $100 collected at the register, Costco retains roughly $11 before covering payroll, warehouse leases, and general overhead. Costco’s figures come from its 10-K, while Walmart’s comes from Zonebourse, comparing it against Costco’s margin in its latest fiscal year.

Indicator Costco Walmart
Gross margin, latest fiscal year 11.09% Not compared here
Gross margin, fiscal year 2025 11.12% 24.2% (latest fiscal year cited by Zonebourse)
Source of operating income, latest fiscal year Roughly 50.6% membership fees, 49.4% warehouse sales Not compared here

The fiscal years compared are not strictly identical; the difference offers an order of magnitude rather than a direct match.

Why keep margins so low? This is an analysis rather than a documented company claim: the model works because Costco can sacrifice retail product margins. Shoppers return for low prices, and membership dues compensate the retailer upfront. Membership fees thus cover a share of earnings that product markups alone would not produce.

A reported markup cap also circulates widely. RetailWire, cited by TheStreet, reported that Costco caps markups at 14% on brand-name goods and 15% on private-label items. This cap is not mentioned in the 10-K and has no official corporate confirmation, meaning it should be viewed with caution.

Finally, gasoline represents a substantial share of total net sales, according to the 10-K. This figure reflects the sheer scale of the fuel operation, though its exact effect on total gross margins is not detailed.

Fewer than 4,000 SKUs per warehouse: curated scarcity

Costco carries fewer than 4,000 active SKUs per warehouse, compared to over 100,000 in a traditional hypermarket according to Zonebourse. This concentrates purchasing volumes and strengthens bargaining power.

According to its 10-K, the company limits its selection across its core warehouse business. A stock-keeping unit (SKU) is a distinct item in the catalog. Online, the fiscal 2025 report cites an average of 9,000 to 10,000 SKUs.

Zonebourse contrasts this strategy with the more than 100,000 SKUs found in a traditional hypermarket. The logic is arithmetic: by stocking fewer product variations, Costco buys each item in massive quantities, improving supplier terms. The publication also notes two warehouses operating in France.

This scarcity relies on a growing store base: 939 warehouses as of August 30, 2026, compared to 914 in 2025 and 890 in 2024, according to the latest 10-K. Every new warehouse provides another distribution outlet for an inventory that remains focused.

Kirkland Signature: Costco’s private label

Kirkland Signature is Costco’s proprietary private-label brand sold in its warehouses. The only numerical reference available is the reported 15% markup cap on private labels, cited by RetailWire via TheStreet and unconfirmed by the company. The 10-K does not detail Kirkland Signature’s exact share of overall sales or earnings.

$19.3 billion in inventory, $22.6 billion in payables: precise turnover

At the close of the fiscal year, Costco’s inventory balance sat lower than its accounts payable, meaning suppliers financed more than the total stock resting in warehouse aisles.

Accounts payable ($22,591m) exceed inventories ($19,324m): suppliers finance the entire stock.
Costco inventories vs accounts payable, FY2026 ($m) — Source: Costco, FY2026 10-K annual report

Inventory turnover measures how many times per year inventory is sold and replaced. Faster turnover means stock spends less time sitting on shelves. According to Zonebourse, Costco turns inventory roughly 13 times a year—about 28 days of inventory on hand—often selling products before invoices come due. This figure comes from secondary market analysis rather than a line item in the 10-K.

The balance sheet shows this relationship in the 10-K: accounts payable exceeded inventory by several billion dollars in Costco’s favor (editorial calculation). In practice, Costco does not front the cash for its merchandise; it relies on supplier financing.

This setup drives operating cash flow. Cash flow from operations increased substantially compared to 2025 and surpassed operating income, according to the filing, though the document does not isolate how much cash flow stems directly from inventory turnover. The link is a plausible business mechanism rather than a proven standalone figure.

$1.50 since the 1980s: the hot dog as a loss leader

The hot dog and soda combo has sold for $1.50 since the mid-1980s, according to OPB/NPR. Industry analysts describe it as a loss leader used to build customer retention.

Nearly 200 million combos were sold during fiscal year 2023, according to OPB/NPR. Forrester analyst Brendan Witcher noted that Costco uses the deal to buy member loyalty: the discounted hot dog secures ongoing customer commitment.

Costco has also managed its production costs. According to OPB/NPR, the retailer has run its own hot dog manufacturing facilities since 2008 to reduce supply costs after previously using Hebrew National as its primary supplier.

Company executives have defended the fixed price publicly. In 2024, Gary Millerchip confirmed the combo’s price was safe, while former CFO Richard Galanti previously explained that Costco’s other revenue streams allow it to maintain those prices. No official reports specify the net financial loss per hot dog sold, leaving the exact dollar cost unconfirmed.

What Costco’s business model reveals—and its limits

Costco’s model operates on a reinforcing loop: thin product margins and a limited catalog attract members, membership fees subsidize low retail pricing, and supplier-financed inventory frees up working capital.

This structure is confirmed in the 10-K filing: membership dues and merchandise operating margins split operating income almost evenly. The model does not run solely on membership fees; it depends on pairing those fees with high-volume merchandise sales that remain profitable even on razor-thin markups.

Membership renewal rates represent the key vulnerability. This is an analysis rather than a market forecast: because North American renewal rates sit above 92%, a drop of even a few percentage points would directly hit half of the company’s operating earnings. The slight dip observed in the second quarter was small, but it represents the metric to watch.

The idea that Costco generates virtually all its earnings from membership dues is contradicted by the figures: in the latest fiscal year, card fees contributed about half of operating income. Fees can exceed that percentage in specific reporting periods, such as the first half of the fiscal year, but they do not make up the entire profit base.

A few analytical caveats remain. Inventory turnover rates and Walmart’s gross margin are sourced from Zonebourse rather than Costco’s SEC filings. The 14% and 15% markup caps lack official corporate confirmation. These figures outline how the model functions without providing an exact audited measurement.

Frequently asked questions

Is Costco profitable without membership fees?

Yes, from an accounting standpoint. Warehouse merchandise sales generate several billion dollars in operating profit, based on calculations from the 10-K. However, those thin retail margins depend heavily on the customer traffic that the membership card attracts. Without membership fees, the existing business setup would not function in its current form.

How many members does Costco have worldwide?

Costco has about 84 million paid members and approximately 150 million total cardholders when factoring in free household cards, according to the latest 10-K filing. More than 42 million are Executive members.

How much money does Costco make each year?

In its latest fiscal year, Costco’s operating income exceeded $11 billion and net income was close to $9 billion, up from fiscal 2025, according to its 10-K report.

Where do most of Costco’s profits come from?

Profits split almost equally: about half of operating income comes from membership fees and the other half comes from warehouse retail sales, based on calculations from the 10-K.

Sources

  1. Annual Report 10-K, Fiscal Year 2026 — SEC (EDGAR) / Costco Wholesale
  2. Annual Report 10-K, Fiscal Year 2025 — SEC (EDGAR) / Costco Wholesale (2025)
  3. Costco raised membership fees for the first time — The Motley Fool
  4. Costco or the art of making money while selling near cost — Zonebourse
  5. Costco hot dogs have cost $1.50 since the 1980s — OPB / NPR (2024)
  6. Costco reveals how it keeps prices low — Yahoo Finance / TheStreet
  7. How Costco makes money — FinanceBuzz

Prepared with the help of AI tools, then fact-checked and edited by the Haut-Hisse editorial team.
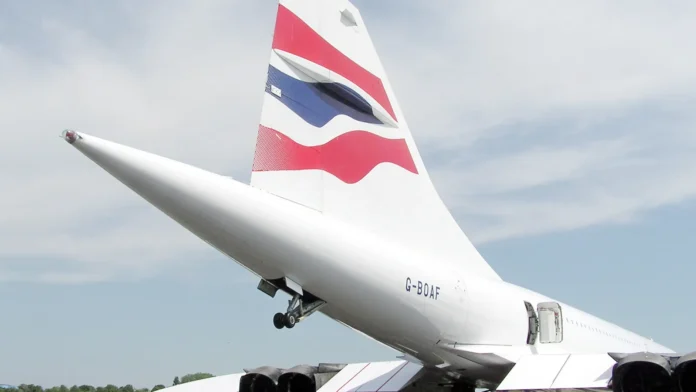
Napoleon Hill et la pensée positive : ce qui tient, ce qui est mythe

0
Illustration for the article on Napoleon Hill's positive thinking

Les secrets de la pensée positive de Napoleon Hill reposent sur une idée en partie solide et sur beaucoup de légendes. La recherche soutient l’intérêt de viser un but en anticipant les obstacles, mais la rencontre avec Andrew Carnegie reste invérifiable et les affirmations répétées peuvent se retourner contre certains.

À retenir

Que dit vraiment Napoleon Hill sur la pensée positive ?

Napoleon Hill défend l’idée qu’un désir précis, nourri par la foi et l’action, conduit à la réussite. Il est né le 26 octobre 1883 à Pound (Virginie) et mort le 8 novembre 1970 à Greenville (Caroline du Sud), à 87 ans.

Son livre le plus célèbre, Think and Grow Rich, paraît en 1937 chez The Ralston Society, en pleine Grande Dépression. Il est crédité à Hill et à Rosa Lee Beeland, qui a contribué substantiellement à l’écriture et à l’édition. Il condense The Law of Success (1928), un ouvrage en plusieurs volumes qui prétendait s’appuyer sur plus de vingt ans d’étude de personnes riches.

Le livre est présenté comme « 13 étapes vers la richesse » : désir, foi, autosuggestion, imagination, planification organisée, persévérance, Master Mind (un petit groupe d’entraide), esprit subconscient… Le décompte exact varie selon les listes.

L’étiquette « pensée positive » vient surtout de la suite. Hill a enseigné son cours « Philosophy of Personal Achievement » avec W. Clement Stone, dirigeant de Combined Insurance, de 1952 à 1962. Les deux hommes ont coécrit Success Through a Positive Mental Attitude, daté de 1959 ou de 1960 selon les passages.

Ce qui relève du mythe

Le mythe le plus répandu est celui de la mission confiée par Andrew Carnegie, mais plusieurs autres récits fondateurs ne résistent pas non plus à la vérification. Les historiens pensent que Hill a inventé plusieurs histoires de ses livres.

La rencontre avec Carnegie

Hill affirmait que sa rencontre avec l’industriel Andrew Carnegie, en 1908, avait lancé sa carrière. Aucune preuve ne soutient cette collaboration. Hill n’a revendiqué cette rencontre qu’après la mort de Carnegie en 1919, et les seuls récits viennent de ses propres écrits.

Le biographe de Carnegie, David Nasaw, déclare n’avoir trouvé « aucune preuve d’aucune sorte » d’une rencontre. Selon EBSCO, les historiens y voient un procédé pour promouvoir les écrits ultérieurs de Hill.

Les interviews de célébrités et le titre d’avocat

Hill disait avoir interrogé de nombreuses figures célèbres. Sa seule rencontre documentée est une brève séance photo avec Thomas Edison, et les historiens doutent aussi qu’il ait été avocat. EBSCO note que beaucoup de ses affirmations et de ses liens présumés avec des personnalités n’ont pas été vérifiés.

Un parcours judiciaire chargé avant 1937

Avant Think and Grow Rich, Hill a eu plusieurs démêlés avec la justice. La Acree-Hill Lumber Company fait faillite en 1908 et fait l’objet d’accusations de fraude postale. Viennent ensuite des mandats d’arrêt en Illinois (juin 1918), une accusation de publicité frauduleuse par la Federal Trade Commission (1919) et une école par correspondance pour détenus dénoncée comme escroquerie (1923).

En 1908, il est aussi arrêté pour altération de chèques, puis acquitté. Son Automobile College of Washington (1909) est exposé comme une escroquerie en 1912. Ces faits n’invalident pas une idée en soi, mais ils invitent à lire ses récits d’origine avec prudence.

Les chiffres de vente

Les biographes de Hill avancent 20 millions d’exemplaires vendus en 50 ans. L’historien Richard Lingeman juge le chiffre considérablement inférieur. Ce qui est établi : le livre est resté l’un des ouvrages de développement personnel les plus vendus jusqu’aux années 2010.

Un mythe voisin : la « célèbre étude de Yale »

On cite souvent une étude où 3 % des diplômés de Yale de 1953, dotés d’objectifs écrits, seraient devenus plus riches que les 97 % restants. La bibliothèque de Yale conclut qu’aucune étude de ce type n’a eu lieu. L’affirmation vient d’un article de Success de septembre 1991, qui s’appuyait sur une cassette de Zig Ziglar sans source concrète.

Ce qui tient : viser un but en anticipant les obstacles

Une partie de l’intuition de Hill est étayée : un but précis aide, à condition d’y associer les difficultés prévisibles. Cette méthode s’appelle le contraste mental : imaginer l’objectif atteint, puis les obstacles réels qui s’en séparent.

Une méta-analyse de 2019 de Cross et Sheffield porte sur le contraste mental appliqué aux comportements de santé. L’effet est petit à modéré : g de Hedges = 0,28 jusqu’à 4 semaines (1 528 participants) et g = 0,38 jusqu’à 3 mois (5 études). Le g de Hedges mesure la taille d’un effet ; autour de 0,2 il est faible, autour de 0,5 modéré. Les résultats concernent la santé, pas la richesse, et le recul à trois mois repose sur peu d’études.

Les expériences de Kappes et Oettingen (2011) vont dans le même sens. Dans quatre expériences, les participants induits à fantasmer positivement leur avenir avaient moins d’énergie, mesurée physiologiquement et comportementalement, que ceux qui imaginaient un avenir remis en question, négatif ou neutre. Dans l’une d’elles, ceux qui fantasmaient positivement leur semaine avaient atteint moins d’objectifs une semaine plus tard que le groupe témoin. Selon les auteurs, ces fantasmes « font paraître l’énergie inutile », alors que des scénarios incluant obstacles et revers mobilisent mieux.

Quand la pensée positive se retourne contre vous

Les affirmations positives ne fonctionnent pas pour tout le monde, et peuvent même nuire à ceux qui en ont le plus besoin. Hill recommande l’autosuggestion, c’est-à-dire se répéter des phrases pour s’en convaincre.

Dans une étude de Wood, Perunovic et Lee (2009), les personnes à faible estime de soi qui répétaient « I am a lovable person » (« Je suis quelqu’un d’aimable ») se sentaient moins bien ensuite. Chez celles à forte estime de soi, le bénéfice était seulement léger. Dans une étude de suivi, laisser les personnes à faible estime de soi lister aussi leurs pensées négatives améliorait davantage leur humeur que de leur demander de se concentrer sur le positif.

Le courant qui a suivi n’a pas échappé aux critiques. The Power of Positive Thinking de Norman Vincent Peale, paru en octobre 1952 et resté 186 semaines sur la liste des best-sellers du New York Times, a été jugé reposer sur des anecdotes invérifiables. Albert Ellis (1985) a mis en garde contre le risque d’échec et de désillusion, et Martin Seligman (2002) a critiqué un optimisme déconnecté des faits. EBSCO rattache les idées de Hill à cette lignée, jusqu’à The Secret de Rhonda Byrne (2006).

Hill, idée par idée : ce qui tient et ce qui ne tient pas

Idée ou récit Verdict Ce que disent les sources
Se fixer un but précis et anticiper les obstacles Soutenu, effet modeste g = 0,28 à 4 semaines sur des comportements de santé
Imaginer uniquement la réussite Contredit Moins d’énergie et moins d’objectifs atteints
Répéter des affirmations positives Mitigé Peut nuire à ceux dont l’estime de soi est faible
Mission confiée par Carnegie en 1908 Mythe Aucune preuve d’une rencontre

Que garder de Hill en pratique ?

Gardez de Hill le but précis et l’action quotidienne, et laissez de côté les récits d’origine et l’autopersuasion à sens unique. Voici une méthode inspirée du contraste mental, à adapter.

  1. Écrivez un objectif concret avec une date. Exemple : « courir 5 km sans m’arrêter avant fin décembre ».
  2. Imaginez-vous l’avoir atteint pendant quelques instants, sans vous y attarder.
  3. Listez les obstacles probables. Exemple : la fatigue après le travail, la nuit qui tombe tôt.
  4. Prévoyez une réponse à chacun : « si je suis trop fatigué le soir, alors je cours à la pause déjeuner ».
  5. Fixez un minimum quotidien réalisable même les mauvais jours (dix minutes), puis faites une revue de dix minutes chaque semaine.

Si vous utilisez des affirmations, privilégiez des formulations réalistes qui renvoient à une action (« aujourd’hui, je termine le premier paragraphe ») plutôt qu’à un trait de caractère flatteur. Si elles vous mettent mal à l’aise, c’est un signal à écouter.

Questions fréquentes

Napoleon Hill a-t-il écrit seul Think and Grow Rich ?

Non. Le livre de 1937 est crédité à Hill et à Rosa Lee Beeland, qui a contribué substantiellement à l’écriture et à l’édition. Hill et Beeland ont divorcé en 1940.

Combien d’étapes compte Think and Grow Rich ?

Le livre est présenté comme « 13 étapes vers la richesse », mais le décompte varie selon les listes, certaines comptant 15 éléments, dont le désir, la foi, l’autosuggestion et le Master Mind.

Quelle différence entre Napoleon Hill et Norman Vincent Peale ?

Hill met l’accent sur le désir, la planification et le groupe d’entraide. Peale publie The Power of Positive Thinking en 1952, centré sur la foi et la confiance. EBSCO place les deux dans la même lignée.

Sources

  1. Napoleon Hill — Wikipedia (2026)
  2. Think and Grow Rich — Wikipedia (2026)
  3. Napoleon Hill — EBSCO Research Starters (2024)
  4. Kappes et Oettingen, Journal of Experimental Social Psychology — LSE Research Online (2011)
  5. Why positive fantasies make your dreams less likely come true — The Psychologist, British Psychological Society (2011)
  6. Wood, Perunovic et Lee, Psychological Science — ScienceDaily / Association for Psychological Science (2009)
  7. The Power of Positive Thinking — Wikipedia (2026)
  8. Yale goals study FAQ — Yale University Library
  9. Cross et Sheffield, méta-analyse sur le contraste mental, Health Psychology Review — PubMed (2019)

Prepared with the help of AI tools, then fact-checked and edited by the Haut-Hisse editorial team.