


Published
The richest country in the world is the one that ranks first on a chosen measure, and the answer changes with that measure. By GDP per capita at purchasing power parity, the IMF’s April 2026 estimates put Liechtenstein first at $195,372. By mean wealth per adult, UBS’s 2025 report puts Switzerland first at $910,382. By total GDP, the United States leads.
Luxembourg’s 2025 GDP per capita was 139% above the EU average, yet its individual consumption per capita was only 45% above. Two of the four countries at the top of the per-person GDP ranking, Ireland and Luxembourg, look much less rich once Eurostat and Ireland’s Central Statistics Office (CSO) adjust for multinationals and cross-border workers. Ireland’s GNI*, a measure corrected for multinational effects, is only about 55% of its GDP.
Key takeaways
- By the IMF’s latest estimates, GDP per capita (PPP) ranks Liechtenstein ($195,372), Singapore ($173,708), Ireland ($159,129) and Luxembourg ($156,719) in the top four. The US is 10th at $94,430.
- UBS’s 2025 report puts Switzerland first for mean wealth per adult ($910,382), ahead of the US ($696,277). For median wealth, Luxembourg leads ($394,005).
- Ireland’s 2025 GDP is far above its GNI*, the measure adjusted for multinationals.
- Luxembourg’s GDP per capita is well above the EU average, but its individual consumption per capita sits much closer to it, partly because cross-border workers add to GDP but spend elsewhere.
- Eurostat’s 2024 and 2025 figures are preliminary and due for revision in December.
Contents
- Who is the richest country in the world, measure by measure?
- What is the richest country in the world per person?
- Is the USA the richest country, or just the biggest economy?
- Why is GDP misleading for Ireland and Luxembourg?
- Which country has the most wealth per adult?
- Mean or median wealth: does Switzerland still come first?
- Which measure of a country’s wealth should you use?
- Frequently asked questions
Who is the richest country in the world, measure by measure?
No single country wins every ranking. Liechtenstein leads GDP per capita (PPP), Switzerland leads mean wealth per adult, Luxembourg leads median wealth per adult, and the United States leads total GDP.
The table below puts the four measures side by side, using the IMF’s latest per-capita estimates, the IMF’s October 2024 GDP figures as compiled by Mister Prépa and UBS wealth data compiled on Wikipedia.
| Measure | First place | Figure |
|---|---|---|
| GDP per capita (PPP), IMF April 2026 | Liechtenstein | $195,372 |
| Total nominal GDP, IMF October 2024 | United States | $26,185 billion |
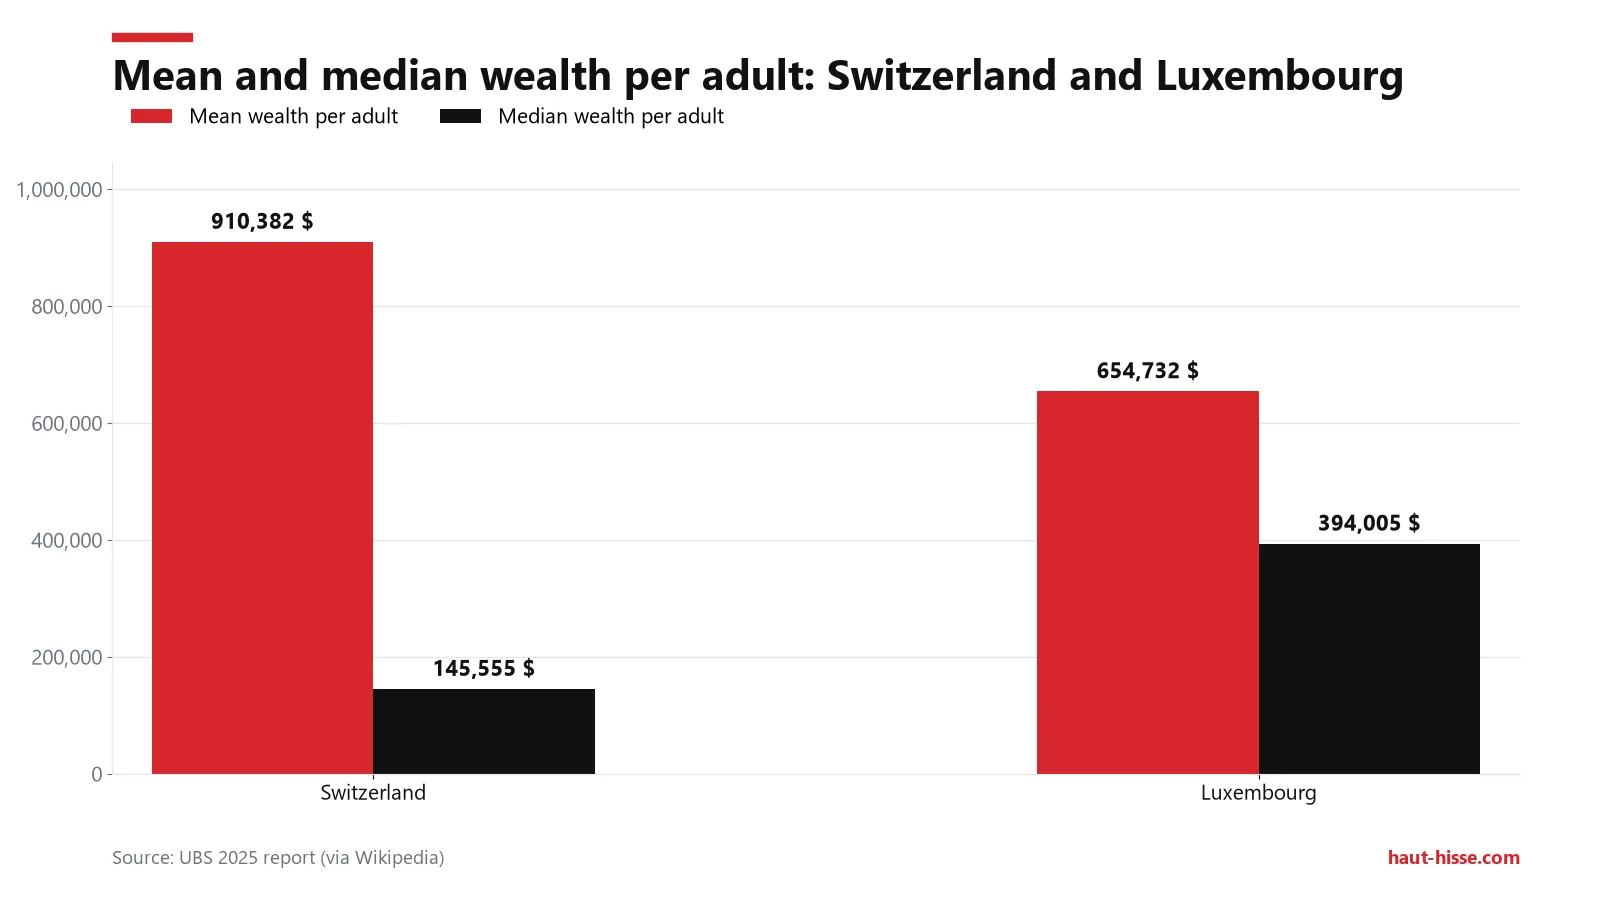
| Mean wealth per adult, UBS 2025 | Switzerland | $910,382 |
| Median wealth per adult, UBS data | Luxembourg | $394,005 |
The runners-up are far from the leaders in some rows. China follows the US in total GDP, and the US follows Switzerland in mean wealth.
The per-capita PPP ranking also moves with the edition. DonneesMondiales’ 2025 data put Singapore first at $155,789, Luxembourg second at $153,817 and Ireland third at $138,506, an earlier vintage than the IMF’s latest estimates. The total GDP figures are 2024 IMF numbers from a compilation that shows inconsistencies between editions, so they should be verified against the IMF’s own tables. The median row is drawn from UBS data via Wikipedia, which cites a more recent UBS edition, and should also be cross-checked.
Switzerland’s lead is a lead in the mean, and whether it survives a switch to the median is settled further down. The same few small countries top both the income and wealth lists, which raises the question of what “per capita” is actually measuring.
What is the richest country in the world per person?
Per person, the IMF’s latest estimates put Liechtenstein first in GDP per capita (PPP), followed by Singapore, Ireland and Luxembourg. The US ranks 10th at $94,430.
Switzerland sits 7th at $105,680. The ranking uses purchasing power parities (PPPs), which the World Bank’s International Comparison Program (ICP) produces so that GDP and GDP per capita can be converted into a common currency. The latest ICP cycle uses 2021 as its reference year and was released in May 2024. PPPs for 2022 and 2023 are extrapolated, so any current ranking rests partly on extrapolation.
Different editions also shuffle the order. On 2025 data, DonneesMondiales has the US 9th at $85,721, Germany 17th at $73,979 and France 27th at $62,371. Of the top 20 in that ranking, 14 countries have fewer than 10 million inhabitants. Small populations make it easy for one industry, one tax regime or one border-crossing workforce to move the average.
Ireland and Luxembourg sit in the top four, yet Eurostat warns that their per-person GDP overstates what residents earn.
Is the USA the richest country, or just the biggest economy?
The US is the largest economy by total GDP, at $26,185 billion in 2024, per IMF October 2024 figures, ahead of China at $21,643 billion. It ranks only 10th per person in PPP terms.
The 2024 total GDP ranking, to be verified as noted above, runs as follows:
- United States: $26,185 billion
- China: $21,643 billion
- Japan: $4,365 billion
- Germany: $4,120 billion
- India: $3,820 billion
Size is not living standards. These are nominal totals, while the per-person ranking is in PPP terms, so the US dropping to 10th at $94,430 reflects a different question, not a decline. On the IMF’s per-capita estimates, the US sits below the four leaders and below Switzerland.
Wealth tells a more favorable story for the US. It is second in mean wealth per adult at $696,277, and UBS’s 2025 report says it held nearly 40% of the world’s dollar millionaires in 2024 and added more than 379,000 that year. A big economy with a large population produces a huge total and a middling average, while the top per-capita ranks go to small countries.
Even the per-capita ranking has a flaw: two of its top four countries are showing numbers that don’t map neatly onto residents’ pockets.
Why is GDP misleading for Ireland and Luxembourg?
Eurostat says Ireland’s GDP per capita is partly explained by large multinationals holding intellectual property, with much of the income returned to owners abroad. In Luxembourg, cross-border workers add to GDP but their consumption is recorded in their home countries.
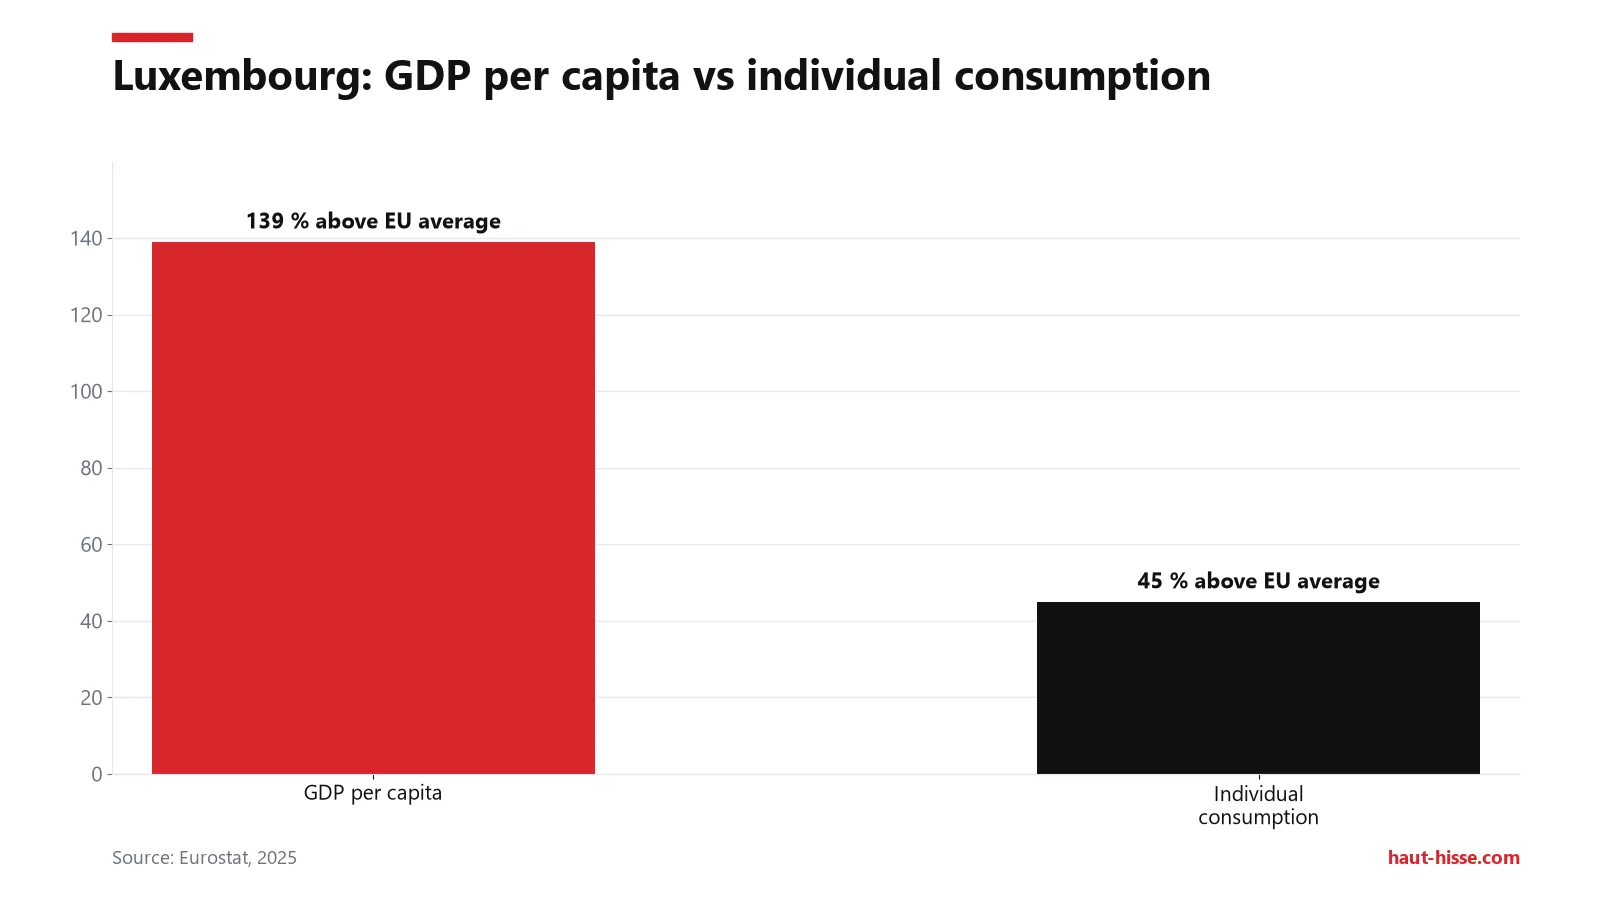
Eurostat’s 2025 data show Luxembourg and Ireland with the highest GDP per capita in the EU, 139% and 138% above the EU average. The agency’s own explanation for Ireland is that this:
“can be partly explained by the presence of large multinational companies holding intellectual property.” — Eurostat
It adds that a large part of the income earned from this production is returned to the companies’ ultimate owners abroad. For Luxembourg, cross-border workers contribute to GDP while their consumption is recorded in their country of residence. That is why actual individual consumption per capita is only 45% above the EU average, against 139% for GDP.
French broadcaster TF1 INFO titled a video on the country “Luxembourg, the secrets of the richest country in the world”, a label that depends heavily on which of those two numbers is used.
Ireland’s own statisticians publish a corrected figure. The CSO puts 2025 GDP at €602.4 billion against €334.0 billion for GNI*, so GNI stands at about 55% of GDP, down from 57.2% to 55.4%. GNI starts from gross national income and adjusts for the factor income of redomiciled companies, depreciation on intellectual property and imported R&D services, and leased aircraft.
The gap also shows up in growth. In 2025, GDP rose 8.0% while GNI* rose 4.7%.
Eurostat’s index shows the drift over ten years. Ireland rose sharply between 2015 and 2025, while Luxembourg fell, so the two countries now sit almost level. Eurostat’s 2024 and 2025 results are still preliminary, and revisions are due in December.
If output-based figures can be distorted, the next question is whether counting what people own gives a cleaner answer.
Which country has the most wealth per adult?
Switzerland, according to UBS’s 2025 report, with mean wealth of $910,382 per adult. The US follows at $696,277, then Luxembourg ($654,732), Hong Kong ($648,267) and Australia ($616,306).

Those figures come from the compiled UBS data. UBS’s own release lists the order as Switzerland, the US, Hong Kong SAR and Luxembourg, so the two neighbors in third and fourth place are close enough to swap between presentations.
Wealth measures what people own, not what an economy produces in a year, which is why it escapes the multinational-profit problem that inflates Irish GDP. UBS reports that global wealth rose 4.6% in 2024, after 4.2% in 2023. More than half of the 56 markets studied saw average wealth per adult fall in real terms, so the global increase was not shared evenly.
Switzerland ranks only 7th in GDP per capita (PPP), so the income and wealth lists diverge even at the top. Wealth accumulates over generations, while GDP records one year’s output.
A mean can be pulled up by a few very large fortunes, so the median may tell a different story.
Mean or median wealth: does Switzerland still come first?
No. On median wealth per adult, Luxembourg leads at $394,005, ahead of Belgium ($277,166) and Australia ($210,783), while Switzerland drops to 8th at $145,555.
The two measures answer different questions. Mean wealth is total wealth divided by the number of adults, so a handful of very large fortunes lift it. Median wealth is the holding of the adult in the middle of the distribution, so extreme fortunes barely move it.
The gap between the two is large in Switzerland: $910,382 mean against $145,555 median. Wealth distribution often produces higher Gini coefficients than income distribution, which is why mean and median can sit so far apart. The Gini coefficient is a standard 0-to-1 gauge of inequality, where higher means a more unequal distribution.
The median ranking comes from UBS data compiled on Wikipedia, and the page cites a more recent UBS edition. It should be cross-checked against the report before being used in a publication.
With four rankings and four winners, the practical question is which one to use for which purpose.
Which measure of a country’s wealth should you use?
Use total GDP for economic size, GDP per capita (PPP) for average output per person, and median wealth per adult for the typical resident’s holdings. Where multinationals or commuters distort the figures, check adjusted measures such as GNI* or individual consumption.
| Question | Measure | Caveat |
|---|---|---|
| How big is the economy? | Total GDP | Ignores population, so the US leads in size but ranks 10th per person |
| How much does the economy produce per person? | GDP per capita (PPP) | Rests on the ICP 2021 cycle with extrapolated years |
| What does a typical adult own? | Median wealth per adult | Drawn from UBS data compiled on Wikipedia, to be cross-checked |
| Is a rich-looking country distorted by multinationals or commuters? | GNI* (Ireland), individual consumption (Luxembourg) | Eurostat’s recent data are preliminary |
For Ireland, GNI* is the correction. For Luxembourg, actual individual consumption per capita is the one to read. The PPP series relies on the ICP’s 2021 reference year, with 2022 and 2023 extrapolated.
A separate World Bank figure is a floor, not a ranking. For fiscal year 2027, the World Bank classes an economy as high-income when its GNI per capita exceeds $14,375 (Atlas method, 2025 data). It says nothing about who is richest, only who is above the line.
Eurostat’s 2024 and 2025 figures remain preliminary and are due for revision in December, so the per-person ranking of Ireland and Luxembourg may still move.
Wealth figures also explain how premium prices work, and the next question is how a luxury house turns buyers’ wealth into a price tag: why luxury costs so much.
Frequently asked questions
What are the top 10 richest countries?
There is no single top 10, because the order depends on the measure. By GDP per capita (PPP), the IMF’s latest estimates have Liechtenstein, Singapore, Ireland and Luxembourg in the top four, Switzerland 7th and the US 10th. By total GDP, the top five are the US, China, Japan, Germany and India.
Which country is the richest in the world, top 10?
On the IMF’s latest per-capita estimates (PPP), Liechtenstein ranks first at $195,372, followed by Singapore, Ireland and Luxembourg. Switzerland is 7th and the US 10th. The 2024 and 2025 Eurostat data behind the Ireland and Luxembourg comparisons are preliminary and due for revision in December.
Who is the no. 1 richest country?
It depends on the question. Liechtenstein leads GDP per capita (PPP) at $195,372, the United States leads total GDP, Switzerland leads mean wealth per adult at $910,382, and Luxembourg leads median wealth per adult at $394,005.
Read next
How these articles are prepared: our editorial policy

